RFK Jr. promises BTC strategic reserve, dollar backed by hard assets
The presidential hopeful gave Bitcoin eloquent praise as a future support for the US economy and way to fix broken American money and society.
The presidential hopeful gave Bitcoin eloquent praise as a future support for the US economy and way to fix broken American money and society.

Zimbabwe’s central bank, the Reserve Bank of Zimbabwe (RBZ), has injected over US$50 million into the interbank foreign exchange market to stabilize the economy. This move comes as the parallel market exchange rate is significantly higher than the official rate, causing economic instability. The RBZ aims to increase foreign currency supply, reduce pressure on banks, […]
Grayscale must await final regulatory signoff on its registration filing before listing the fund
The two Republican senators claimed that if their party wins control of the Senate, they will stop the SEC’s “regulation by enforcement.”
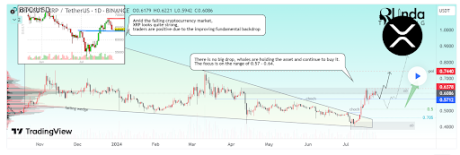
Crypto analyst RLinda has revealed that XRP is showing impressive strength despite the decline in Bitcoin and Ethereum’s price. She explained why XRP suddenly has such a bullish outlook, considering that the crypto token has underperformed since the start of the year. XRP Is The “Strongest” In The Market RLinda mentioned in a post on TradingView that XRP is the strongest in the market. She noted that the crypto token has been holding quite well as traders and investors are again becoming bullish on XRP due to its “improving fundamental backdrop.” She alluded to the long-running legal battle between the US Securities and Exchange Commission (SEC) and how Ripple CEO Brad Garlinghouse recently stated that he expects the lawsuit to end “very soon.” Related Reading: Crypto Analyst Says Bitcoin Is Headed For $260,000 But This Must Happen First RLinda also mentioned the rumors that the SEC’s closed-door meeting on July 25 was related to a potential settlement with Ripple. As such, these bullish fundamentals have led to rising trading volumes, prices hitting local highs, and increased whale activity. Bitcoinist recently reported that XRP whales accumulated over 140 million XRP tokens this past week. Network activity on the XRP Ledger (XRPL) has increased significantly, with a notable increase in the number of new addresses on the network and total addresses interacting on the network, both metrics at their highest levels since March. This again highlights the bullish sentiment that investors are beginning to have towards XRP in anticipation of higher prices. These investors expect that the conclusion of the legal battle between the SEC and Ripple could trigger a massive rally for XRP, especially considering that this case is believed to have been a stumbling block to XRP’s growth in the 2021 bull run. XRP is also long overdue for such a rally, seeing how it has consolidated for over six years. As such, an end to the lawsuit could provide the much-needed catalyst to spark such price movement. Interestingly, crypto analysts like JackTheRippler previously predicted that XRP could climb as high as $100 once the case between the SEC and Ripple ends. Key Price Levels To Watch Out For RLinda mentioned that the price range between $0.6378 and $0.5712 is worth paying attention to from a technical perspective. She claimed that XRP’s price may test liquidity below the support before subsequent growth if it fails to break the resistance level at $0.6378. She also highlighted another crucial resistance level at $0.7440. Related Reading: Ethereum Whales Rapidly Accumulate ETH Amid Price Decline Meanwhile, according to RLinda, $0.5712 and $0.5100 are crucial support levels that XRP needs to hold above, as a drop below these levels could invalidate its bullish outlook. The analyst again alluded to the lawsuit and asserted that it would give XRP a “second life.” She suggested this could lead to a successful breakout from the $0.6378 price level, which she added will “open a new path” for the crypto token. At the time of writing, XRP is trading at around $0.6, up almost 1% in the last 24 hours, according to data from CoinMarketCap. Featured image created with Dall.E, chart from Tradingview.com
US Senator Lummis recently authored a report highlighting the benefit of the Bitcoin mining industry and denouncing Biden’s proposed 30% tax.

According to the blockchain-based prediction market Polymarket, there is an 84% likelihood that former President Donald Trump and current Vice President Kamala Harris will debate before the election. Trump has shown hesitation to debate Harris until her official nomination, citing significant confusion within the Democratic party. High Stakes: $142,846 Wager on Trump-Harris Debate Before Election […]
The former National Security Agency contractor did not name any particular US or international lawmakers but warned many didn’t belong to the “tribe” of Bitcoiners.
Altcoins are in accumulation territory after experiencing a drawdown over the last 3 months.
“Triple maxi” Bitcoin bulls could earn a net worth of $214 million by 2045, Saylor said.