Bitcoin Could Close March With First Ever Quarterly Bear Signal
Bitcoin has had its most profitable quarter on record dollar for dollar, rising more than $25,000 in Q1 alone. But despite the enormous bullish impulse, the price action has left behind the first ever bearish divergence on quarterly timeframes in the asset’s history.
Making matters worse, March is historically be worst month on record for the top cryptocurrency over the course of the last ten years. Could the bearish signal combined with this factor result in a much more sizable correction across crypto?
Bearish Divergences Stack Against Bitcoin On Quarterly Timeframes
2020 was the year of the pandemic, and the year of Bitcoin. During that time, Bitcoin price spent the first three quarters of the year ranging between $4,000 and $10,000, but once that range was finally broken towards the end of the year, there were fireworks come Q4.
Q4 is traditionally a time for enjoying the fruits of one’s labor with Thanksgiving and other holiday celebrations, and this year was especially fruitful for investors who weathered the long crypto winter.
Related Reading | Bitcoin Shakes Off Dollar Rebound But Beware Of Coming Bear Phase
With an unprecedentedly negative year in the rear view, the exuberance of the celebrations have carried well into Q1 2021, and taken Bitcoin to its best quarter ever in terms of total dollars gained.
Q4 resulting in a stunning $18,000 added to the price per BTC, while in Q1 2021 alone, there’s already been another $28,000 added to each coin’s price tag, with more than two thirds of the month of March left to go.
However, according to one crypto analyst, Bitcoin price would need to rise another $20,000 or so to bring indicators high enough to close the month out without falling victim to several bearish divergences on the quarterly candle.
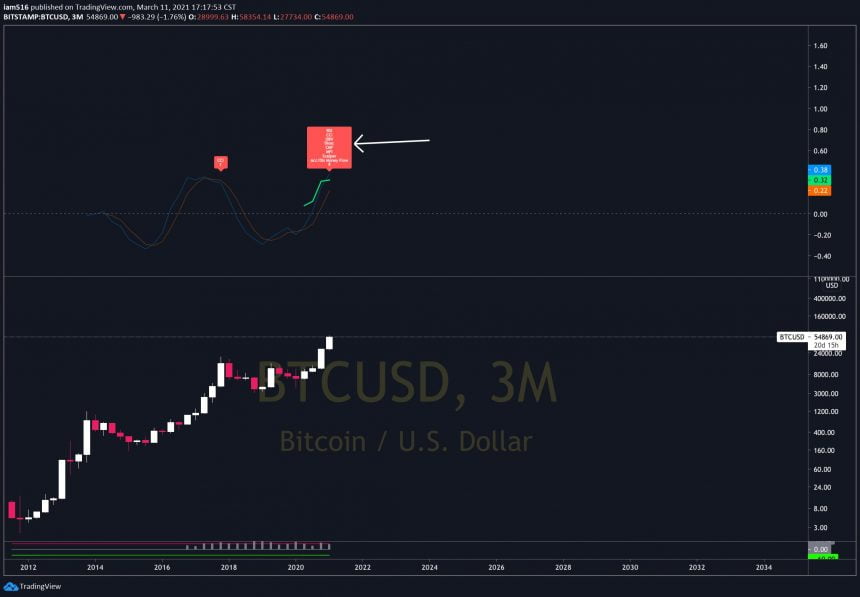
Several popular trading indicators are signaling a bearish divergence | Source: BTCUSD on TradingView.com
Why Probabilities Point To A Correction, Not Continuation For Crypto
The sharp-eyed trader checking the not-often watched timeframe was able to spot a bearish divergence on the Relative Strength Index, RSI, On-Balance Volume, Chaikin Money Flow, Money Flow Index, Commodity Channel Index, and the Accumulation/Distribution technical indicators.
Related Reading | Why March Is The Bloodiest Month In Bitcoin History
In this past, this many technical indicators stacking with bearish divergences on Bitcoin, resulted in one of the strongest uptrends in the cryptocurrency’s history.
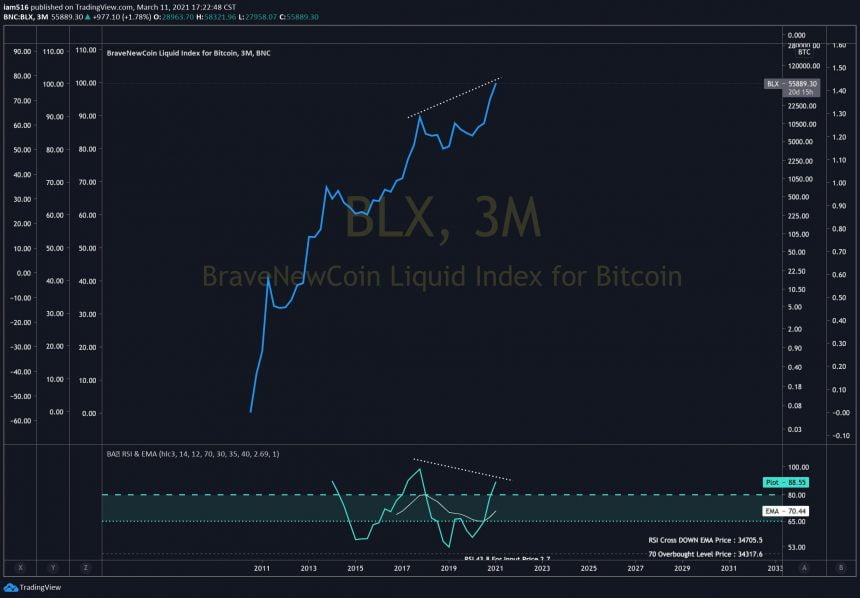
The bearish divergence on the RSI is clear as day. | Source: BTCUSD on TradingView.com
The chart above shows how clear the bearish divergence is. To avoid these signals confirming with a bearish reversal in the short-term, Bitcoin price would need to continue tor climb by “$20,000 to $30,000” more before the end of March.
However, March is historically the worst month on record for Bitcoin, and that makes the probability of such a continued move unlikely.
But then again, this is Bitcoin and this bull market is the most powerful yet, so anything at all is possible, including another $20,000 to $30,000 move in less than 20 days.
Featured image from Deposit Photos, Charts from TradingView.com