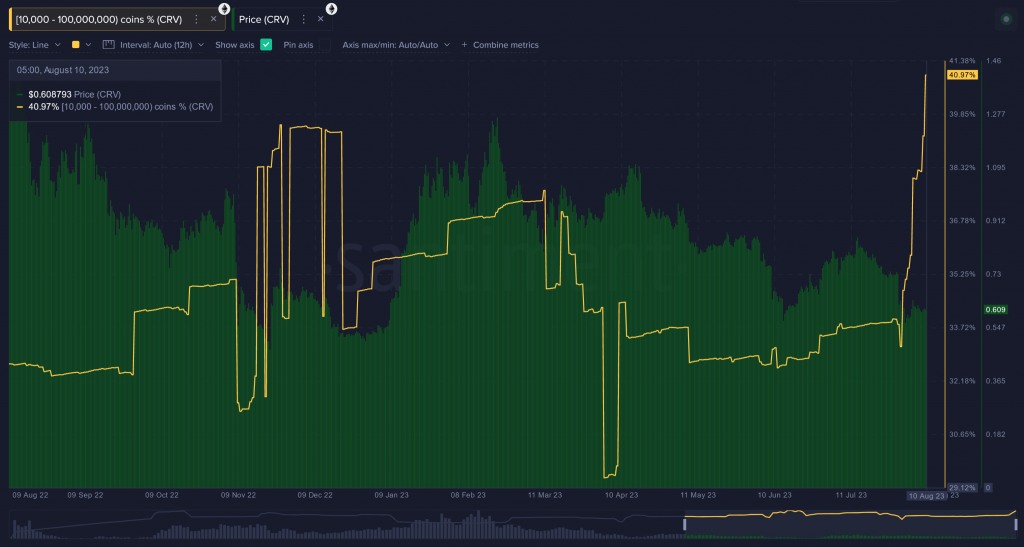
Category: Cryptocurrency News

Cryptocurrency News and Public Mining Pools

Kaching! Bitcoin Cash (BCH) Price Explodes Over 100% – What’s Powering It?

Bitcoin Cash (BCH) recently experienced a remarkable surge, registering more than 100% increase. As one of the leading digital currencies, Bitcoin Cash has often been compared to its predecessor, Bitcoin (BTC), but it has also carved its own path in the ever-evolving crypto landscape. BCH, a cryptocurrency born out of a hard fork from Bitcoin in August 2017, shares the same underlying technology as its predecessor but aims to address some of the scalability issues that Bitcoin faced. With its larger block size and faster transaction times, Bitcoin Cash aimed to become a more efficient and accessible form of digital currency. However, it has faced its fair share of scrutiny and volatility over the years.  Now, with its recent meteoric rise, the question on everyone’s mind is: What factors are driving this surge in Bitcoin Cash’s price, and what does it mean for the future of this digital asset? Bitcoin Cash Emerges As Top Performer Bitcoin Cash BCH has exhibited an exceptional performance, positioning itself as one of the leading performers over both short and long timeframes. Over the past seven days, BCH has shown an impressive surge, soaring by a remarkable 106.3%. Source: Coingecko Even in the past 24 hours, it remains a top contender with a gain of 2.8%, defying the prevailing sentiment of stagnation observed in recent days. The current trading price for BCH, according to CoinGecko, stands at $226.69, further solidifying its upward trajectory. Meanwhile, Bitcoin, the flagship cryptocurrency, experienced a significant breakthrough by surpassing the $30,000 mark with remarkable momentum, briefly breaching the $31,000 threshold before the start of the weekend. BCH market cap currently at $4.5 billion. Chart: TradingView.com However, the bullish momentum was unable to sustain itself, leading to a resurgence of selling pressure and subsequently pushing the price back towards the $30,000 level. At the time of writing, the primary cryptocurrency is trading around $30,444, reflecting a meager setback in its upward trajectory. Factors Driving BCH Price Surge Recent developments have shed light on the factors driving the impressive surge in the price of Bitcoin Cash (BCH). According to a new BCH price report, the launch of EDX Markets, a cryptocurrency exchange backed by industry giants Citadel Securities, Charles Schwab Corp., and Fidelity Digital Assets, has significantly benefited BCH. EDX Markets will offer trading services for various cryptocurrencies, including Bitcoin Cash, providing increased accessibility and liquidity for BCH investors. Bitcoin Cash price trajectory in the last seven days. Source: CoinMarketCap Furthermore, another significant catalyst for the surge of the crypto’s price can be attributed to its recent game-changing upgrade. In May, Bitcoin Cash underwent a network hard fork that not only enhanced the network’s security and privacy measures but also introduced plans for CashTokens. This innovative feature holds immense potential for building decentralized applications (dApps) on the Bitcoin Cash blockchain, opening up new possibilities and driving increased adoption. (This site’s content should not be construed as investment advice. Investing involves risk. When you invest, your capital is subject to risk). Featured image from Wit Olszewski/Shutterstock

TrueUSD Depegs on Binance.US, Drops to 80 Cents Against Tether

submitted by /u/lordciders [link] [comments]

BlackRock has ‘50% chance’ of getting spot Bitcoin ETF approved: Analyst

Bloomberg’s senior ETF analyst believes BlackRock has an even chance of getting its Bitcoin ETF green-lit, as Grayscale looks more likely to win its case against the SEC.

Bitcoin Mining Firm Riot Secures 33,280 Mining Rigs Ahead of Halving

submitted by /u/Odd-Radio-8500 [link] [comments]

Bitcoin miners send record $128M in revenue to exchanges

Bitcoin miners have sent up to 315% of their daily revenue to exchanges but BTC prices are yet to react.

RVN removed from Binance.us

Looks like Racen has been removed altogether. My balance still shows in my wallet and can be withdrawn but it doesn't show up in any trading pairs or anywhere else on the site. Anyone hear any news on this? submitted by /u/Jblock22 [link] [comments]

Monero (XMR) Higher 13 Days In A Row: What’s Next?

An altcoin with a long and storied history, Monero is currently running to the upside in a way it never has before. After closing higher for twelve consecutive days – a new record for the privacy-focused altcoin – Monero looks poised to once again make history with a thirteenth straight higher close. What’s happened after other Monero winning streaks in the past? Let’s take a closer look at the price history to find out. Monero Win Streak Making History Monero’s current winning streak of twelve consecutively higher closes breaks the previous record set in 2021 of ten straight higher closes. While the price advance is clearly impressive, its unprecedented nature means we’ll have to look at earlier and shorter win streaks to get an understanding of what might be ahead for Monero in the future. In other words, we’ll use the prior shorter historical win streaks to generate enough occurrences to make a more statistically meaningful conclusion. Monero 2023 Winning Streak | XMRUSD on TradingView.com   Monero 2021 Winning Streak | XMRUSD on TradingView.com Related Reading: After Raising $3M, HedgeUp (HDUP) Receives Influx of Shiba Inu (SHIB) and Monero (XMR) Investors Because the number of occurrences varies based on holding time, we’ll start by listing the number of times that six straight higher closes has happened next to our several hypothetical hold times of 7 days through 365 days. Holding time is defined as the amount of time one held the asset before exiting. For example, if one hypothetically purchased Monero following the trigger event (i.e., 6 straight higher closes) and sold it 30 days later, this would be a holding time of 30 days. Monero Occurrences of Six Consecutive Higher Closes by Holding Time (May 2014 – Present) 12 occurrences using a 7-day hold time 12 occurrences using a 15-day hold time 12 occurrences using a 30-day hold time 11 occurrences using a 60-day hold time 11 occurrences using a 90-day hold time 7 occurrences using a 180-day hold time 5 occurrences using a 356-day hold time While the number of occurrences remains limited even with the shorter win streak, past Monero winning streaks of six consecutively higher closes provides enough data to examine so let’s dive into the analysis. Past Monero Win Streaks Suggest More Strength Ahead The hypothetical average trade results for Monero (XMR) show a consistent positive edge across all holding times from 7 days through one year. Please note that even though the average historical trade results are positive for each hold time we examine, losses have also occurred for each hold time. Monero Hold Time Results for Six Straight Higher Closes | SOURCE: Tableau Going out to a roughly three-month hold time, the past win streaks have delivered far greater gains on average, with an average trade of +65.1% with a 90-day hold, +121.7% with a 180-day hold, to an impressive +373.8% with a 365-day hold. Related Reading: Solana (SOL), Monero (XMR), and DigiToads (TOADS) Form an Unbeatable Trio for Crypto Investors While we’ve certainly never seen a streak of consecutively higher closes to match the current twelve and nearly thirteen, Monero’s long price history suggests that more strength could be ahead, especially going out to three months and beyond. DB the Quant is the author of the REKTelligence Report newsletter on Substack. Follow @REKTelligence on Twitter for evidence-based crypto market research and analysis. Important Note: This content is strictly educational in nature and should not be considered investment advice. Featured images created with Tableau. Charts from TradingView.com.

“Cocaine is a Helluva Drug” – Rick James | Cocaine – $COKE | The Game-Changer of Memecoins! | Fair Launch is Live!

About Cocaine- $COKE Token Cocaine ($COKE) is a community-driven cryptocurrency project born out of the desire to create a unique memecoin that offers both fun and potential value for its holders. While maintaining a playful tone, Cocaine's mission is to disrupt the status quo with a limited supply of tokens. With only 100,000 tokens, the…
Read more

LINK Price Prediction: Chainlink Could Lift-off Toward $8

Chainlink’s LINK price is showing positive signs above $6.00. The price could rise further if it clears the $6.30 and $6.50 resistance levels. Chainlink token price is showing positive signs and rising from $5.00 against the US dollar. The price is trading above the $6.00 level and the 100 simple moving average (4 hours). There was a break above a major bearish trend line with resistance near $5.10 on the 4-hour chart of the LINK/USD pair (data source from Kraken). The price could extend its recovery and rally toward the $8.0 resistance zone. Chainlink (LINK) Eyes More Gains After a major decline, LINK price found support near the $5.0 zone against the US Dollar. A low was formed near $5.004 and the price started a fresh increase, similar to Bitcoin and Ethereum. There was a clear move above the $5.10 and $5.50 resistance levels. Besides, there was a break above a major bearish trend line with resistance near $5.10 on the 4-hours chart of the LINK/USD pair. The upward move gained pace above the $5.80 resistance. LINK even jumped above $6.0 before the bears appeared. A high is formed near $6.37 and the price is now consolidating gains. Chainlink price is now trading above the $6.00 level and the 100 simple moving average (4 hours). It is also showing positive signs above the 23.6% Fib retracement level of the upward move from the $5.00 swing low to the $6.37 high. On the upside, the price is facing resistance near the $6.35 zone. Source: LINKUSD on TradingView.com The first major resistance is near the $6.50 zone. A clear break above $6.50 may possibly start a fresh increase toward the $7.20 and $7.25 levels. The next major resistance is near the $7.80 level, above which the price could revisit $8.0. Dips Supported? If chainlink’s price fails to climb above the $6.50 resistance level, there could be a downside correction. Initial support on the downside is near the $6.05 level. The next major support is near the $5.70 level, below which the price might test the 61.8% Fib retracement level of the upward move from the $5.00 swing low to the $6.37 high at $5.50. Any more losses could lead the price toward the $5.00 level in the near term. Technical Indicators 4 hours MACD – The MACD for LINK/USD is losing momentum in the bullish zone. 4 hours RSI (Relative Strength Index) – The RSI for LINK/USD is now above the 50 level. Major Support Levels – $6.05 and $5.70. Major Resistance Levels – $6.35 and $6.50.

Which Countries Have the Best Crypto Tax Laws?

submitted by /u/dAn_tHe_mAn7 [link] [comments]