Category: Cryptocurrency News

Cryptocurrency News and Public Mining Pools

Compromised wallet holding ENS NFT

I got hacked in January, multiple wallets got drained, very upsetting. One of the wallets has an ENS domain I'd like to keep and consider valuable (they didn't transfer it) – it's currently in the expiry grace period. I would need to transfer eth to the wallet though to be able to renew and transfer…
Read more

Huge shakeup for crypto in the U.S.

In a significant development for the U.S. cryptocurrency industry, the United States House Financial Services Committee has successfully passed two crypto regulatory bills. The bills, named the Financial Innovation and Technology for the 21st Century Act and the Blockchain Regulatory Certainty Act, were approved by a majority of U.S. lawmakers on July 26. The bills,…
Read more

Why Is Bitcoin And The Crypto Market Up Today?

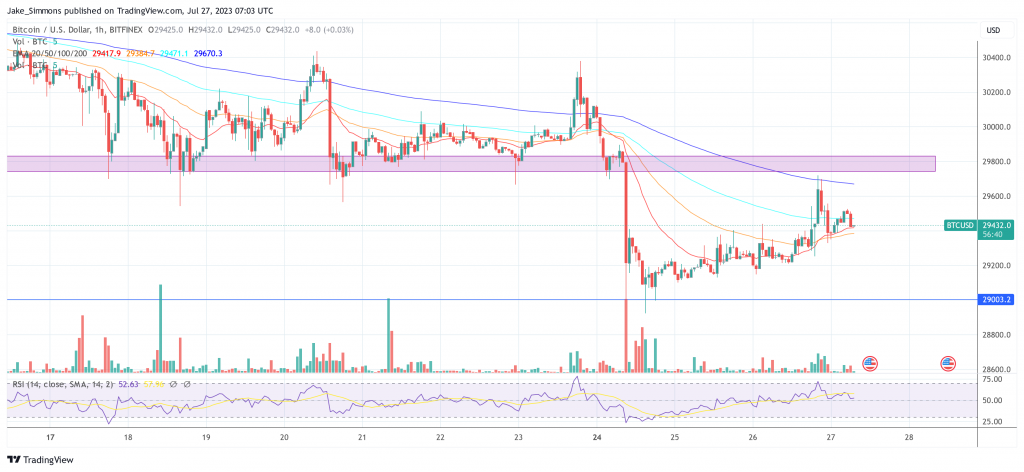
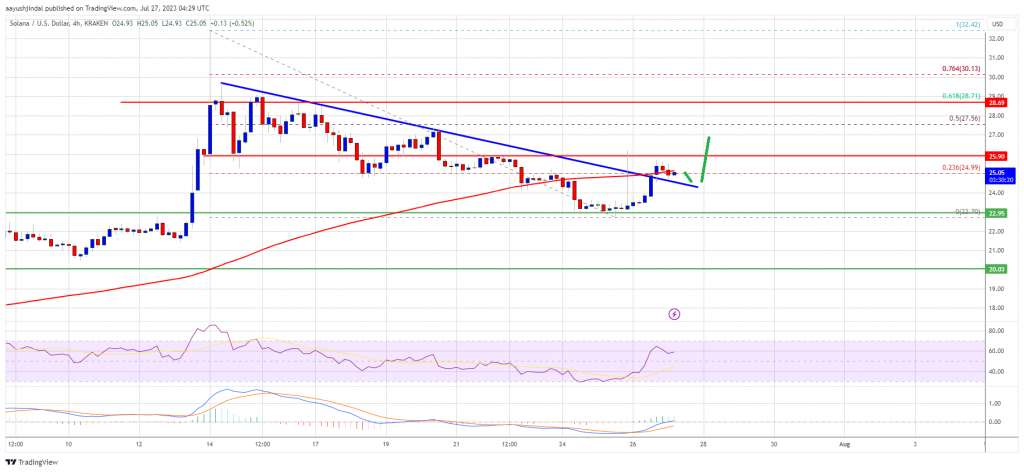
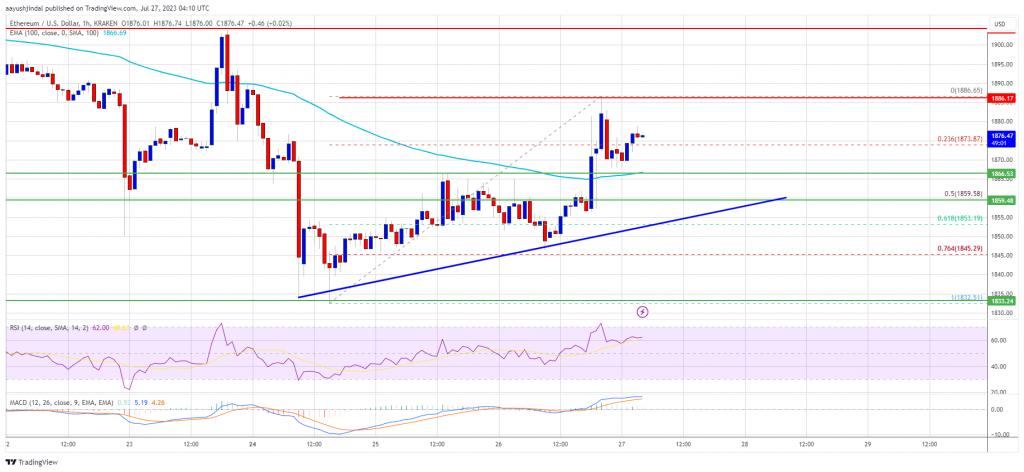
The Bitcoin and crypto markets are experiencing a slight upswing today, with BTC and other major altcoins making gains. The main catalyst behind this uptrend appears to be yesterday’s Federal Open Market Committee (FOMC) meeting. At the time of writing, Bitcoin’s price is up by 0.8% in the last 24 hours, currently trading at $29,486. Despite facing resistance around the critical resistance area of $29,750, BTC has shown resilience and is attempting to reclaim its upward trajectory. Moreover, other major cryptocurrencies are also in the green, with Ethereum (+1.0%), XRP (+1.4%), Cardano (+3%), and Solana (+7%) all enjoying gains. Bitcoin Follows TradFi’s Reaction The FOMC meeting has been a focal point for the crypto market’s movements. Federal Reserve Chairman Jerome Powell reiterated that the central bank remains data-dependent, indicating that further interest rate hikes are not ruled out. However, no decision on the matter has been reached yet. Related Reading: FOMC Delivers Expected 0.25% Rate Hike, Bitcoin Holds Steady Above $29,000 Powell emphasized that core inflation (both PCE, CPI) remains the primary focus. He also stated that FED will stop raising rates way before the inflation target of 2% is reached. However, the big bummer was his statement that he does not expect inflation to fall below 2% before 2025! Bitcoin experienced a quick dip in response to this Powell statement, but quickly rebounded, seemingly following the trajectory of traditional financial markets. Notably, the Dow Jones rose for a 13th consecutive day after the FOMC meeting yesterday, signaling investors’ confidence in a bullish market sentiment. Related Reading: Bitcoin Pre-Halving Patterns Suggest Bull Market Is Not Starting In 2023 Experts and analysts in the cryptocurrency space have offered diverse opinions on the implications of the FOMC meeting and Powell’s remarks. Jim Bianco, an influential figure in the financial industry and founder of Bianco Research LLC, highlighted the lack of clarity in the Fed’s communication, stating: It is provided the LEAST amount of information of any meeting since they started hiking in March 2022. Powell is going out of his way to say nothing and not commit to anything. So, this meeting has become a Rorschach test. Everyone sees into it what they want. And this is seemingly what the traditional finance as well as crypto markets are doing. The big question is: how long will the Fed hold rates up, how long before it pivots. As this is data dependent, no one knows, but market expectations and the Fed’s projections still seem far apart. While the CME’s FedWatch tool currently predicts a slight majority in favor of a first rate cut already in March 2024, Powell made it clear yesterday in a hawkish tone that the key rate must remain high for a long time because the effects need time to have an impact on the economy. Market expectations and the Fed’s projections still seem far apart. #Bitcoin #SPX After the #FOMC meeting, the market expects the first rate cut in March 2024 (54.6%). Powell could keep the key rate higher for longer due to the strong economy. Who will cave in first? pic.twitter.com/4C9KPAuTmv — Jake Simmons (@realJakeSimmons) July 27, 2023 Charles Edwards, founder of Capriole Investments noted the unprecedented tightness in current economic conditions due to the combination of money supply growth and negative interest rates. He suggested that historical trends indicate a strong possibility of a one-way bull market emerging under these conditions: Powell has overtaken Volcker as the tightest Fed chair ever. Economic conditions have never been tighter than today, […]. In all prior instances, inflation was well under control, the stock market was higher 12 months later and a major one way bull market trend emerged. Crypto analyst Michael van de Poppe, expressed concern about the Fed’s projection that a recession is not on the horizon. He speculated, “Most likely no more rate hikes. […] Have a terrible GDP today and sweep the lows on Bitcoin before we continue the party up. Buy the dip season.” At press time, the Bitcoin price still slowly grinds towards the red resistance area below $29,800. Featured image from iStock, chart from TradingView.com

Polygon Warning Signs Point To Slide In MATIC Price On Support Breakdown

Polygon (MATIC) has been experiencing a mix of price action, with a 24-hour rally of 3.5% that hints at potential positive movement. However, the coin has suffered a 4.4% slump over the past seven days, indicating underlying bearish sentiments in the market.  Despite the short-term surge, the weekly time frame presents a negative outlook, primarily due to the failure to break through a long-term horizontal resistance. Adding to the bearish pressure, an ascending trendline has been broken, signaling a potential further decline in MATIC’s price. Source: Coingecko One of the significant factors contributing to MATIC’s current bearish scenario is its inability to surpass the significant resistance zone of around $0.80. Related Reading: Litecoin Bulls Barrel Back Toward $92 Level – Will They Succeed? This area had been acting as a strong support level for the altcoin, providing stability during various price fluctuations. However, this support became a formidable resistance over the past two weeks, thwarting MATIC’s attempts to climb higher. Polygon (MATIC) Ascending Trendline Breakdown An ascending trendline is a sloping line that connects a series of ascending lows in an uptrend. It represents a rising level of support and is often used to gauge the strength of a bullish trend. The breakdown of this trendline indicates a shift in sentiment, suggesting that buyers are losing control and sellers are gaining momentum. MATIC market cap currently at $6.8 billion. Chart: TradingView.com The breakdown of the ascending trendline sets the stage for a potential 22% drop in MATIC’s price. If the coin fails to find strong support at lower levels, this decline could be the next crucial movement for the cryptocurrency. Traders and investors must closely monitor price action to determine if MATIC can stabilize or if further losses are on the horizon. Bear Trap Scenario And Bullish Recovery However, there is a glimmer of hope for MATIC’s price trajectory. If buyers can push the current price above $0.729221, it could invalidate the recent bearish breakdown. Related Reading: Binance Coin (BNB) Price Poised For A Major Breakout – Which Way Will It Go? This move could create a bear trap scenario, where traders anticipating a continued decline may be forced to cover their short positions, leading to a sudden surge in buying activity. If this scenario plays out, it could assist MATIC in initiating a bullish recovery. MATIC price movement in the last week. Source: CoinMarketCap As an observer of the cryptocurrency market, it’s essential to acknowledge that the price of the MATIC token and other digital assets can be highly volatile and subject to various technical and fundamental factors. While the current price action may raise concerns for some investors, it’s essential to remember that market conditions can change rapidly.  (This site’s content should not be construed as investment advice. Investing involves risk. When you invest, your capital is subject to risk). Featured image from CoinChapter

UFO hearing: Crypto degens spare no time crafting 50 alien shitcoins

In the wake of the US government being accused of covering up extraterrestrial activity, crypto degens were quick to sprout a shiny batch of memecoins.

SOL Price Prediction: Solana Hints At Potential Fresh Rally To $30

Solana is attempting a fresh increase above the $25 resistance against the US Dollar. SOL price might continue to rise steadily toward the $30 zone in the near term. SOL price is showing positive signs above the $24 level against the US Dollar. The price is now trading near $25 and the 100 simple moving average (4 hours). There was a break above a major bearish trend line with resistance near $24.80 on the 4-hour chart of the SOL/USD pair (data source from Kraken). The pair could continue to move up if it clears the $26 resistance zone. Solana Price Starts Recovery After a steady decline, Solana’s price found support near the $22.75 zone. SOL traded as low as $22.70 and recently started a recovery wave, unlike Bitcoin and Ethereum. The price climbed above the $24 and $24.50 resistance levels. There was a break above a major bearish trend line with resistance near $24.80 on the 4-hour chart of the SOL/USD pair. The pair climbed above the 23.6% Fib retracement level of the downward move from the $32.42 swing high to the $22.70 low. SOL is now trading near $25 and the 100 simple moving average (4 hours). On the upside, immediate resistance is near the $25.90 level. The first major resistance is near the $26 level. A clear move above the $26 resistance might send the price toward the $28.80 resistance. Source: SOLUSD on TradingView.com The 61.8% Fib retracement level of the downward move from the $32.42 swing high to the $22.70 low is also near the $28.80 level. Any more gains might send the price toward the $30 level. Another Drop in SOL? If SOL fails to clear the $26 resistance, it could start a fresh decline. Initial support on the downside is near the $24.80 level and the broken trend line. The first major support is near the $24 level. If there is a close below the $24 support, the price could decline toward the $22.75 support. In the stated case, there is a risk of more downsides toward the $20 support in the near term. Technical Indicators 4-Hours MACD – The MACD for SOL/USD is gaining pace in the bullish zone. 4-Hours RSI (Relative Strength Index) – The RSI for SOL/USD is above the 50 level. Major Support Levels – $24.00, and $22.75. Major Resistance Levels – $26.00, $28.80, and $30.00.

House Financial Services Committee Votes in Favor of Crypto, Blockchain Bills

submitted by /u/RedBunery [link] [comments]

Digital marketing will become Web3's next major use case, says report

More than 70 startups have raised over $600 million in the embryonic Web3 digital marketing sector.

Ethereum Price Recovery Could Soon Fade If It Fails To Clear $1,900

Ethereum price is recovering above the $1,850 zone against the US Dollar. ETH could restart its decline if there is no move above the $1,900 resistance. Ethereum is slowly moving higher above the $1,850 zone. The price is trading above $1,870 and the 100-hourly Simple Moving Average. There is a key bullish trend line forming with support near $1,855 on the hourly chart of ETH/USD (data feed via Kraken). The pair could face a strong selling interest near the $1,900 and $1,920 levels. Ethereum Price Faces Uphill Task Ethereum’s price started a short-term recovery wave from the $1,830 zone. ETH was able to recover above the $1,850 and $1,860 levels, similar to Bitcoin. However, the bears are still active below the $1,900 level. A high is formed near $1,886 and the price is now consolidating gains. There was a minor decline below the 23.6% Fib retracement level of the upward move from the $1,832 swing low to the $1,886 high. Ether is now trading above $1,870 and the 100-hourly Simple Moving Average. There is also a key bullish trend line forming with support near $1,855 on the hourly chart of ETH/USD. The trend line is near the 50% Fib retracement level of the upward move from the $1,832 swing low to the $1,886 high. On the upside, immediate resistance is near the $1,885 level and the recent high. The first major resistance is near the $1,900 level. The next key resistance is near the $1,920 level. A close above the $1,920 resistance could set the pace for a larger increase. Source: ETHUSD on TradingView.com The next resistance is near the $1,975 zone, above which the price might rise toward the $2,000 hurdle. Any more gains could send Ether toward the $2,050 resistance in the near term. Fresh Decline in ETH? If Ethereum fails to clear the $1,900 resistance, it could start a fresh decline. Initial support on the downside is near the $1,865 level and the 100 hourly SMA. The first major support is near the $1,855 zone or the trend line, below which the price might move into a bearish zone. The next major support is near the $1,830 support level. Technical Indicators Hourly MACD – The MACD for ETH/USD is losing momentum in the bullish zone. Hourly RSI – The RSI for ETH/USD is now above the 50 level. Major Support Level – $1,855 Major Resistance Level – $1,900

Redditor's hacked Bitcoin is a lesson on the hidden dangers of paper wallets

“My Bitcoin was taken. How?” A Reddit user thought they were following best practices until two days ago when their Bitcoin wallet was completely cleaned out.