Bitcoin falls to $84K: Is Japan’s bond market the culprit, or is more at play?
Bitcoin’s decline to $84,000 was driven by US dollar stablecoin concerns, a weakening global macroeconomic outlook and factors beyond Japan’s bond market stress.
Bitcoin’s decline to $84,000 was driven by US dollar stablecoin concerns, a weakening global macroeconomic outlook and factors beyond Japan’s bond market stress.
A sudden drop in XRP balances across major crypto exchanges has led to speculations about how this might affect the cryptocurrency’s price action. The movement was highlighted by analyst Vincent Van Code, who explained that the transfers are not simply a sign of long-term holders scooping up supply. Instead, he pointed to the expanding influence of newly launched Spot XRP ETFs, which are now absorbing a significant share of market activity that once took place on retail platforms. ETF Demand Is Pulling Liquidity Away From Exchanges Van Code noted that billions of XRP leaving Binance, Upbit, and Kraken are largely flowing into ETF custodial wallets. This changes the way the market reacts to buying and selling pressure because retail exchanges now operate with thinner liquidity. When daily trading volume on those platforms averaged around the multi-billion-dollar range, it required very large orders to create noticeable price movement. Related Reading: Why XRP Will Not Reach $100 By End Of Year Despite ETF Launch Now that volume has contracted, even moderate-sized trades can produce sharp intraday swings. The effect is a market environment that is fundamentally supported by ETF buying, yet increasingly sensitive to smaller sell-offs or sudden bids. Even as exchange liquidity drops, Van Code noted that high-frequency trading firms are preventing price dislocations. These groups have already mastered the arbitrage models used in Bitcoin and Ethereum ETFs, and they have now adapted the same systems for XRP. Whenever the ETF price drifts above or below its underlying value, the bots immediately correct the gap, keeping both markets tightly aligned. This mechanism makes sure that XRP still gets purchased during ETF creation events and provides a layer of structural stability, even though retail charts may begin to show more frequent spikes and dips. What This Means For XRP’s Approach To New Price Highs In Van Code’s view, the long-term picture for XRP is strengthened by this shift, even though the short-term experience for traders may become more uncomfortable. When XRP enjoyed daily spot volumes in the range of $2 billion to $3 billion on exchanges, you would typically need more than $200 million in concentrated buying or selling to push the price 5% to 10% in either direction. Related Reading: Analyst Predicts 10x Rally For XRP Price If This Trend Repeats Now that on-exchange volume has dropped toward levels below $1 billion a day, the equation looks very different. A sell order or resistance wall of around $15 million can now swing XRP by roughly 12% to 18% within a single hour in these thinner conditions. However, the saving grace is these arbitrage bots. According to the analyst, XRP is still on track to reach $5. However, until the price adapts to reduced spot volume on exchanges, traders should be prepared for air pockets up to 20% in price, where relatively modest buy or sell flows can cause outsized moves. Featured image from Peakpx, chart from Tradingview.com

This is Part Five of the eight-part series: Can I Pay With This: A stablecoin experiment in Buenos Aires. Thank you to the Ethereum Foundation and the EV Mavericks for their support, without which this experiment could never have happened. Part One: Decentralized or Destitute <– New? Start here. Money, monkeys and mild terror Part…
Read more
The move could challenge other prediction platforms by providing Kalshi users with greater anonymity through tokenized buys and sales on the Solana blockchain.

The appointments come ahead of a planned SPAC merger that will create a publicly traded company dedicated to accumulating and staking Cronos’ native token.

Veteran trader Peter Brandt dropped an image on Monday breaking down bitcoin’s five major bull runs, pointing out that every single one kicked off only after the market absorbed 75%-plus drawdowns. Brandt stressed there are “no exceptions,” and if someone thinks they’ve found one, a trader “better have a great reason to bet against this […]

submitted by /u/002_timmy [link] [comments]
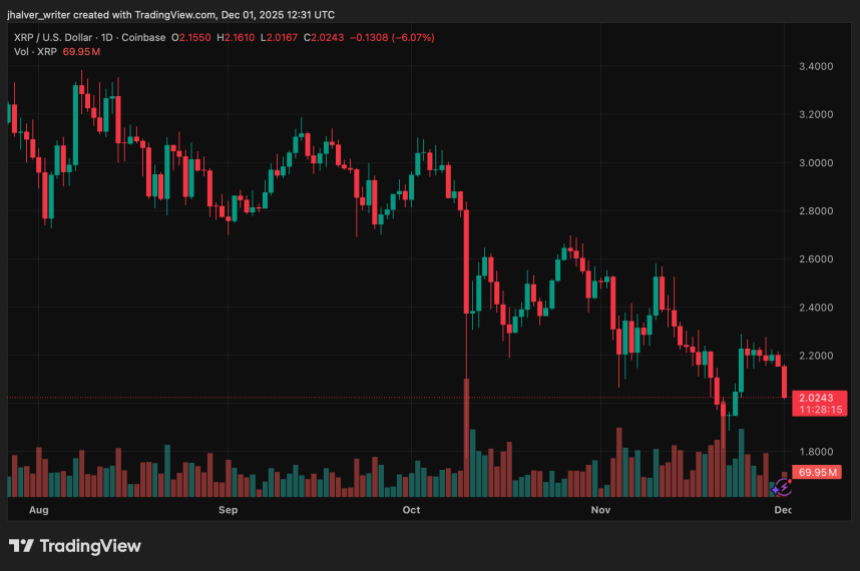
XRP is entering December with a mix of unusual market signals, steady price action, and renewed bullish expectations from analysts and prediction platforms. Related Reading: $300 Million Crypto Bet: Kazakhstan’s Central Bank Gears Up Despite the general instability and uncertainty in the crypto market, traders continue to monitor XRP’s behavior above the $2.0 range as new data points shape sentiment. XRP’s price trends to the downside on the daily chart. Source: XRPUSD on Tradingview One-Sided Liquidations Highlight Market Imbalance Liquidation data from CoinGlass recorded an unusual reading this week after XRP posted $0 in short liquidations during a one-hour window. All losses came from long positions, totaling about $128,000. Such a clean one-sided liquidation profile is rare in active derivatives markets and immediately stood out across the crypto sector. Other major assets, such as Bitcoin and Ethereum showed typical liquidation activity on both sides. For XRP, the imbalance suggested that leveraged traders were heavily positioned for upside, leaving long holders exposed even to small price movements. Despite this, XRP’s price has not been immune to the broader market downturn, which saw the total crypto market cap drop by more than 5%. XRP slipped toward the $2.04 area, but analysts note that the $2.00 zone remains a key support level. On the upside, $2.20 continues to act as the immediate resistance level to watch. Technical Outlook Points to a Potential December Breakout XRP ended November down more than 17%, mirroring a broad market decline that has seen Bitcoin fall to $86,700 and several altcoins record double-digit losses. This drop came despite positive developments, including strong early inflows into newly approved crypto ETFs and the growth of Ripple USD (RLUSD). On the charts, XRP continues to trade around the Murrey Math Lines pivot. Analysts highlight a bullish flag pattern forming on the eight-hour timeframe, which is typically a continuation structure that may trigger a breakout. A successful move higher could send the token toward $2.73, the next major resistance. Mixed Prediction Market Signals but Strong Community Confidence Prediction markets are split on XRP’s near-term prospects. Kalshi data shows a 69% probability that XRP will end the year with a positive return, reflecting strengthened sentiment after weeks of consolidation. In contrast, Polymarket assigns a 99% chance to XRP reclaiming the ATH by 2026. Related Reading: XRP Hit By Violent 59% Leverage Flush As Speculators Slam The Brakes Despite the divergence, the community outlook remains firm. Traders point to XRP’s steady range, rising ETF interest, and resilience during volatility as indicators of potential upside. As December unfolds, XRP’s narrow trading band and unusual liquidation patterns are setting the stage for this decisive month. Cover image from ChatGPT, XRPUSD chart from Tradingview

The cryptocurrency tumbled 7% in less than 24 hours. Explanations for the drop remain murky, leading many to speculate that something fishy is going on. Unseen Hands: Are Whales Secretly Controlling Bitcoin’s Value? Six large exchanges showed outflows of nearly 40,000 BTC on the same day, according to a popular crypto trader who goes by […]

Though the US dominated the number of requests from agencies in individual countries, Coinbase reported a modest increase in the overall number outside the country.