Bitcoin Bull Market: Pundit Reveals When To Sell Everything
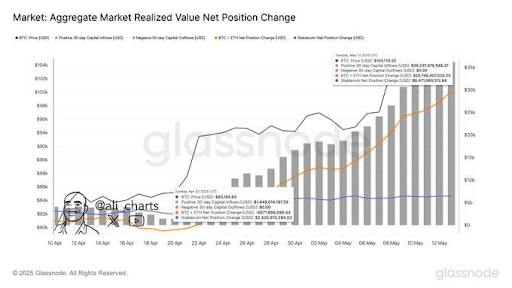
The Bitcoin bull market looks to be back following BTC’s surge above $100,000. With market participants again accumulating following this recent rally, crypto pundit Ardizor has revealed when to sell everything to avoid roundtripping on gains made in this bull market. When To Sell Everything In This Bitcoin Bull Market In an X post, Ardizor stated that he will sell nearly everything in this bull market when BTC’s “Profitability Index” rises above 300% and crypto becomes more popular on TikTok or Instagram, and when market participants think they are the “smartest.” He further outlined three other events that could mark the top and act as a clue to sell everything. Related Reading: Why The US-China 90-Day Tariff Slash Can Push Bitcoin Price Above $110,000 The first is when crypto exchange Coinbase becomes the number one on the app store for two months, and every taxi driver starts speaking crypto. The other two clues are when the BTC Coin Days Destroyed (CDD) metric rises above 300 million and when old friends are inquiring about whether they should buy crypto now. He asserted that the Bitcoin bull market will reach its peak when these things begin to happen. Until then, Ardizor revealed that he will be accumulating more coins daily. The pundit also told crypto community members that he would announce publicly when it was time to sell everything. In another X post, Ardizor provided insights into how investors should allocate their capital in this Bitcoin bull market. He stated that 40% should be invested in BTC, 20% in ETH, 10% in “quality alts,” 5% in high-potential meme coins, 15% working capital, and 20% in USDT to buy dips. Market participants are actively accumulating more coins with the Bitcoin bull market in play following BTC’s rally above $100,000. Crypto analyst Ali Martinez cited Glassnode’s data while revealing that $35 billion has flowed into the crypto market in the past three weeks. A Possible Top For BTC In This Market Cycle Market experts have provided the price targets that could mark the BTC top in this Bitcoin bull market. Veteran trader Peter Brandt stated that the leading crypto is on target to reach the bull market cycle top in the $125,000 to $150,000 level by August or September this year. Once that happens, he predicts that a 50% correction will follow. Related Reading: Analyst Predicts Bitcoin Price Surge To $120,000 And Then A 50% Crash To $60,000, Here’s When Crypto analyst CrediBULL Crypto also reaffirmed that his target for this Bitcoin market cycle is $150,000. However, he also raised the possibility of BTC reaching $200,000 based on Jim Cramer’s statement that the leading crypto cannot achieve that target in this bull run. Standard Chartered has also predicted that $200,000 is achievable for BTC by year-end. At the time of writing, the Bitcoin price is trading at around $103,600, up in the last 24 hours, according to data from CoinMarketCap. Featured image from Getty Images, chart from Tradingview.com