Author: dfmines

Cryptocurrency News and Public Mining Pools

Zcash (ZEC) Leads Market Pullback With 24% Drop, Analysts Warn Of Another Crash Ahead

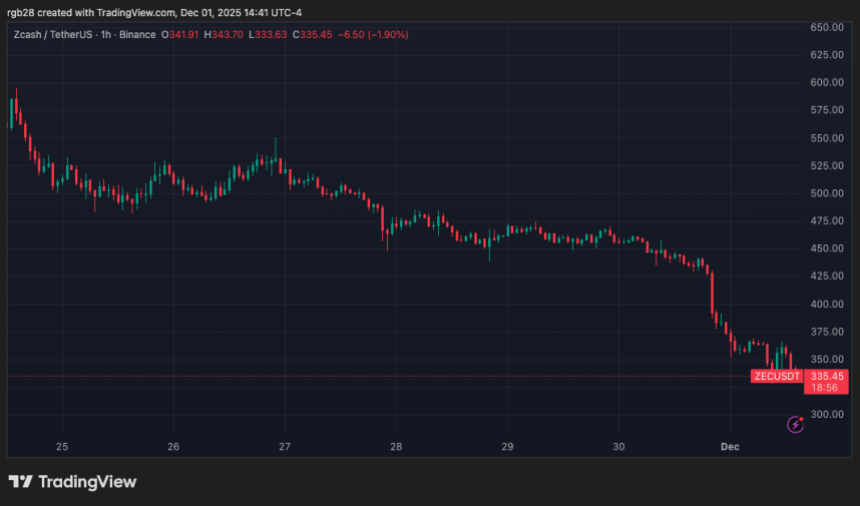
As the whole crypto market bled, Zcash (ZEC) started December with a massive one-day pullback, leading the losses among top cryptocurrencies. While some market observers suggest that the altcoin is positioned for a major move, others have warned that the price risks another major correction in the coming weeks. Related Reading: Is Strategy Buying Bitcoin Again? Saylor’s ‘Green Dots’ Suggest Yes Zcash Loses Key Support Levels Amid Crash Following the late Sunday market correction, Zcash has lost crucial levels and fallen to one-month lows. Over the past three months, the cryptocurrency has seen a parabolic rally, surging over 1,775% to its all-time high (ATH) of $750 in early November. Since its ATH rally, the altcoin has been trading within the $440-$720 levels, bouncing between the range’s upper and lower boundaries amid the recent market volatility. However, the end-of-November pullback saw ZEC’s price unsuccessfully retest its key support area, closing the day below this area for the first time in nearly a month. After losing this zone, Zcash continued to drop below other key support levels, breaking down the $400 barrier and hitting a local low of $328 on Monday morning before bouncing to the $340 area. Amid this performance, some market observers warned that the altcoin could be in trouble and further bleeding may occur in the coming weeks. Sjuul from AltCryptoGems highlighted that ZEC registers the biggest price drops in the weekly and daily timeframes, with declines of 40.2% and 24%, respectively. The analyst previously pointed out that the cryptocurrency lost its uptrend after falling below the EMA200, recording “a perfect bearish retest followed by a strong rejection” last week. As a result, Sjuul suggested that if Zcash did not reclaim the key moving average, the cryptocurrency would be positioned for a breakdown to lower support levels. Similarly, Altcoin Sherpa considers that ZEC could drop another 30%-40% to the $200 area after losing the crucial $440 support. Nonetheless, he added that the price will likely see short-term bounces during its retracement. ZEC’s Correction: Nothing To Worry About? Mert Mumtaz, Helius co-founder and CEO, affirmed that a correction after a 700% rally “is normal,” adding that the privacy token “looks great” on higher timeframes. Notably, the cryptocurrency still shows 700% and 485% increases on the three-month and one-year timeframes. The CEO also highlighted Zcash’s strengths: “privacy is not a narrative, private money is the entire purpose of crypto,” suggesting that the altcoin is positioned to challenge other leading cryptocurrencies like XRP in the future. Meanwhile, another pseudonym market watcher considers that Zcash is preparing for a big move despite the correction. According to X analyst Make Sense, the cryptocurrency is at a make-or-break level after falling to the $320 mark, its first major support area below the November range. If ZEC holds the current range, the price could reclaim its recently lost range and bounce to its $500-$600 mid-range. On the contrary, if it loses its current levels, the cryptocurrency could retest the $280 and even $200 area, he affirmed, before a trend reversal. Related Reading: Will Bitcoin (BTC) End 2025 In Green? November Close May Hold The Key “This is where market makers decide the next trend: bounce early → mid-range rally or deep sweep → full trend reversal. Either way, volatility is about to explode,” he explained. As of this writing, Zcash is trading at $338, a 20% decline in the monthly timeframe. Featured Image from Unsplash.com, Chart from TradingView.com

Ripple, major VCs back RWA platform OpenEden to scale tokenized Treasurys

OpenEden has raised an undisclosed round backed by Ripple and major institutions to expand tokenized US Treasurys.

Casa Achieves SOC 2 Type II Attestation for Self‑Custody Platform

Casa completed a SOC 2 Type II audit covering April 1–Nov. 15, 2025, attesting to its controls for security, availability, processing integrity, confidentiality and privacy. Casa co‑founder and CSO Jameson Lopp said that the bitcoin self‑custody firm successfully passed a SOC 2 Type II audit conducted by Prescient Assurance, reporting that controls to prevent unauthorized […]

Why would retail buy crypto instead of stocks?

Crypto unfortunately has too much competition right now. Stocks are offering better returns with better liquidity. Gold and silver are going up. High yield savings and money markets showing demand. Gambling has gone mainstream and prediction markets are exploding. It use to be crypto was the best place to go to for exciting returns and…
Read more

Revisiting $85,000: Bitcoin Price Drop Linked To Japanese Government Bonds

After a brief period of consolidation and a bullish uptick to around $93,000 at the end of last week, the Bitcoin price has once again dipped toward the $85,000 mark, recording a significant 7% drop on Monday, according to data from CoinGecko.  Market expert Shanaka Anslem has pointed to what he refers to as “the weapon” behind this latest crash: Japanese government bonds.  Expert Warns Of Unraveling Yen Carry Trade In a post on social media platform X (formerly Twitter), the expert highlighted that the yield on Japan’s 10-year bonds reached 1.877 percent on December 1, 2025—the highest level since June 2008—while the 2-year yield hit 1 percent, a benchmark not seen since before the collapse of Lehman Brothers. He explained that these rising yields have triggered a significant unwinding of what Anslem describes as the largest arbitrage trade in history: the Yen Carry Trade.  Related Reading: Dogecoin Whale Activity Drops To Deepest Level In Two Months With estimates placing the total size of this trade at around $3.4 trillion and figures nearing $20 trillion, he noted that this allowed global investors to borrow Japanese yen at minimal costs to buy a variety of assets, including stocks, US Treasuries, and cryptocurrencies like Bitcoin. However, this era appears to have ended last month. The mechanics of this situation are straightforward but impactful, Anslem asserted. As yields rise, the yen strengthens, making leveraged positions increasingly unprofitable.  He suggested that this leads to a chain reaction: selling triggers margin calls, which in turn causes further liquidations. On October 10, $19 billion in crypto positions were liquidated, marking the largest single-day wipeout in crypto history. By November, Bitcoin exchange-traded funds (ETFs) saw $3.45 billion exit the market, with BlackRock’s IBIT suffering a $2.34 billion loss. On December 1 alone, an additional $646 million was liquidated before lunchtime. Will The Bitcoin Price Plunge To $75,000? This decline has occurred alongside the Bitcoin price correlations with major stock indices, showing a 46% correlation with the Nasdaq and a 42% correlation with the S&P 500.  Anslem noted in his analysis that what was once perceived as an “uncorrelated hedge” has now transformed into a leveraged indicator of global liquidity conditions. Related Reading: Is Strategy Buying Bitcoin Again? Saylor’s ‘Green Dots’ Suggest Yes Interestingly, despite the Bitcoin price collapse, whale investors accumulated 375,000 BTC during this period. Moreover, miners significantly cut back their selling, reducing monthly sales from 23,000 BTC to just 3,672.  As the market looks ahead, the expert asserted that a pivotal moment approaches on December 18 with the Bank of Japan’s upcoming policy decision.  Anslem concluded that if the bank opts to raise rates and signal further increases, the Bitcoin price could test the $75,000 level, which would represent an additional 11% drop for the market’s leading cryptocurrency from current trading levels.  Featured image from DALL-E, chart from TradingView.com 

Strategy Amasses $1.44 Billion Reserve and Buys More Bitcoin

submitted by /u/DryMyBottom [link] [comments]

Kucoin Secures MiCAR License for Europe-Wide Crypto Services

Kucoin has obtained a MiCAR license in Austria, giving its European entity the ability to offer regulated crypto services across 29 EEA countries. The approval marks a major milestone in the exchange’s global compliance strategy and strengthens its position as a fully regulated digital asset provider. MiCAR Approval Grants Kucoin EU Authorization to Operate Across […]

XRP Crashes 9.5%, But TD Sequential Flashes A Buy Signal

A cryptocurrency analyst has pointed out how the Tom Demark (TD) Sequential has just given a buy signal on the weekly XRP price chart. TD Sequential Is Printing A Weekly Buy Signal For XRP In a new post on X, analyst Ali Martinez has talked about a TD Sequential signal that has appeared on the weekly XRP chart. The “TD Sequential” refers to an indicator from technical analysis (TA) that’s generally used for locating points of probable reversal in a given asset’s price. Related Reading: Ethereum Speculators Add $654M In Bets As Price Plunges To $2,800 It involves two phases: the setup and countdown. In the first phase, the “setup,” the indicator counts up candles of the same polarity (that is, whether red or green) up to nine. Once these nine candles, which don’t have to be consecutive, are in, it gives a reversal signal. Naturally, this signal is a bullish one if the candles leading up to the setup’s completion were red. Similarly, the asset may see a bearish turnaround if the candles were green. As soon as the setup is over, the second phase, the “countdown,” picks off. This phase is quite similar to the setup, with the only difference being that the TD Sequential counts up thirteen candles here instead. After the thirteen candles of the countdown are also in, the asset could be considered to have reached another point of trend exhaustion. In other words, it may be likely to see another reversal. Now, here is the chart shared by Martinez that shows the TD Sequential setup that has formed in the 1-week price of XRP: Looks like the signal has appeared after nine red candles | Source: @ali_charts on X As displayed in the above graph, XRP has completed this TD Sequential setup with nine red candles, a sign that the bearish trend may have reached an end. The signal has appeared as the cryptocurrency’s price has started to breach below the $2.0 level following a significant decline of 9.5% during the past day. It now remains to be seen whether XRP will now turn itself around like the TD Sequential suggests, or if more bearish price action is in store. Another digital asset that has witnessed a TD Sequential setup is Ethereum. In its case, the signal may be holding up so far. Related Reading: Newbie Bitcoin Whales Capitulating, But Old Hands Stay Silent As Martinez has highlighted in another X post, Ethereum’s 12-hour price completed a setup with nine green candles on Saturday. Since this bearish signal has emerged, Ethereum’s price has plummeted back to the $2,750 level and has erased its recent recovery gains. XRP Price At the time of writing, XRP is floating around $2, down more than 9% in the last seven days. Featured image from Dall-E, charts from TradingView.com

High Court Dismisses Former Binance Executive’s Lawsuit Against Nigerian Agencies

The Nigerian High Court dismissed the unlawful detention lawsuit filed by former Binance executive Tigran Gambaryan against two government agencies. Judicial Rationale for Dismissal A Nigerian High Court has dismissed the lawsuit filed by former Binance executive Tigran Gambaryan against the Economic and Financial Crimes Commission (EFCC) and the Office of the National Security Adviser […]