
Why Vitalik believes quantum computing could break Ethereum’s cryptography sooner than expected
Buterin warns that quantum computers could threaten Ethereum’s cryptography sooner than expected and outlines how the network can prepare safely.
Buterin warns that quantum computers could threaten Ethereum’s cryptography sooner than expected and outlines how the network can prepare safely.
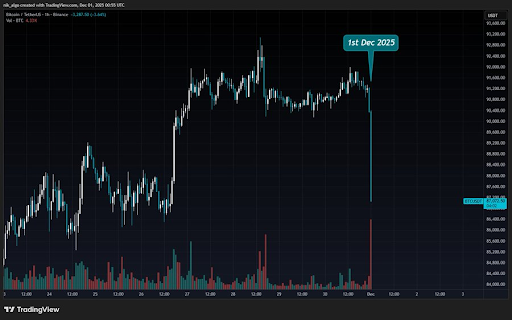
Crypto analysts Nik and Doctor Profit have provided insights into why the Bitcoin price is crashing today. The flagship crypto has again dropped below the psychological $90,000 level, sparking bearish sentiments among market participants. Why The Bitcoin Price Is Crashing Today In an X post, Nik remarked that the Bitcoin price didn’t dump because of bad news but because the “clock flipped.” He noted that a large number of algos sold off at the same time with the daily close, and also considering that it is a new week and a new month. The analyst added that it is not traders making decisions but portfolios rebalancing in real time. Related Reading: Finance Expert Says Bitcoin Price Growth Is In ‘Google 2017’ Phase, What This Means Nik explained that with this Bitcoin price crash, inventories have adjusted, hedges have reset, and risk has been flushed from the market. He noted that the candles may look emotional, but that the behavior is mechanical. The analyst also indicated that retail investors may have also dumped their coins out of panic. Nik stated that time-based algos usually ignite the sell-off, and then everyone is forced to react to their flow. He added that the effect was strong enough today to shake the Bitcoin price, with the crash dragging the broader crypto market along. BTC dropped below $90,000 today, after recovering to $92,000 last week. Meanwhile, Nik stated that most people usually miss the signs of a potential Bitcoin price crash because they focus on patterns drawn by humans rather than flows controlled by machines. He added that the market doesn’t only react to price but also to time. Not Yet Enough Liquidity For A Major Crash In an X post, crypto analyst Doctor Profit said that there isn’t enough downside liquidity yet to trigger a major Bitcoin price crash. This is why he expects a sideways range between the current price and the EMA50, around $100,000, in the coming days or weeks. The analyst noted that the two largest liquidity clusters in the short term are at the $97,000 and $107,000 regions. Related Reading: Analyst Who Predicted Bitcoin Price Action With Chinese Astrology Shares When Prices Will Surge However, Doctor Profit remains bearish in the long term. He declared that a major move down is planned, but that the script must be followed and that the required liquidity is not yet in place. The analyst told market participants to expect a boring sideways phase with confirmed targets of between $70,000 and $75,000 by the start of 2026. Doctor Profit reiterated that such moves to the downside for the Bitcoin price take time. He explained that the crash could unfold as a strong drop, followed by a long sideways consolidation, then a fake relief rally, and then the continuation of lower lows. At the time of writing, the Bitcoin price is trading at around $85,800, down over 5% in the last 24 hours, according to data from CoinMarketCap. Featured image from Pixabay, chart from Tradingview.com

submitted by /u/mudgen [link] [comments]
Bitcoin fell further thanks to Wall Street selling pressure, while analysis predicted a key few days for the 2025 BTC price candle.

Cryptocurrency exchange provides emergency relief to support communities devastated by severe flooding across Southeast Asia, with 420 lives lost and tens of thousands displaced. Bybit has committed $100,000 in humanitarian aid to support relief efforts in Sri Lanka following Cyclone Ditwah. The disaster has caused catastrophic flooding across Indonesia, Malaysia, Thailand, and Sri Lanka, resulting […]
submitted by /u/KIG45 [link] [comments]
Hello guys, I started investing in crypto about 2.5 yrs ago. BTC was around 25k, SOL was around 25e, so prices were pretty low as I started buying. I did DCA, putting every month xxx Euros in my account and splitting those into few altcoins… December 2024, my portfolio hit all time high; I had…
Read more
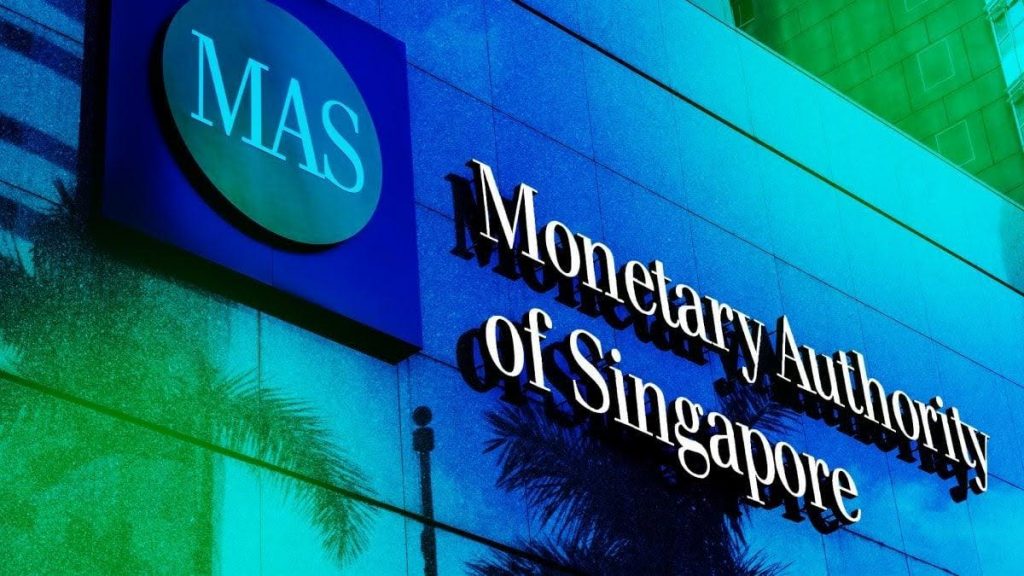
Key Takeaways: Ripple wins approval from Singapore’s MAS to expand the scope of its Major Payment Institution (MPI) license. The move unlocks broader regulated crypto payment services using XRP and RLUSD across Singapore. Asia Pacific’s on-chain activity is up roughly 70% year-over-year, positioning Singapore as a core hub for Ripple’s expansion. Ripple has secured another…
Read more
submitted by /u/CapoDoFrango [link] [comments]

This content is provided by a sponsor. WhiteBIT, the largest European cryptocurrency exchange by traffic, today announced its official launch in the United States, establishing WhiteBIT US as an independent entity designed to scale and operate locally across the country. The launch marks a strategic expansion into the world’s most regulated and institutionally driven digital […]