Dont Understand Different Modes of Heat Maps
| |
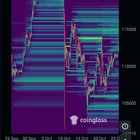
Modes 1-3, all with the same liquidity threshold (1), same timeframe (monthly). All with the same perpetual (binance) Why the hell are they so different (1 doesnt look like its on the same timeframe as the others), and is there ANY explanation for the different modes? mode 1 looks like itll be smooth sailing upward (trending). mode 2 looks like there is more resistance below than high… so not a smooth sailing experience, but still upward (at least to 135k?~) (trending) mode 3 looks like there is SOLID resistance at 117k and 107k… (so another two bounces) (range) submitted by /u/Bwinks32 |