XRP Price Consolidates Before Liftoff — Is a Breakout on the Horizon?
XRP price started a consolidation phase above the $2.320 zone. The price is now rising and might aim for an upside break above $2.450.
- XRP price started a decent increase above the $2.3650 zone.
- The price is now trading above $2.380 and the 100-hourly Simple Moving Average.
- There is a connecting bullish trend line forming with support at $2.3580 on the hourly chart of the XRP/USD pair (data source from Kraken).
- The pair might start another increase if it clears the $2.450 resistance.
XRP Price Eyes Steady Increase
XRP price started a fresh downside correction in a range and traded below the $2.380 zone, unlike Bitcoin and Ethereum. There was a move below the $2.3650 and $2.350 levels. The price tested the $2.3350 zone.
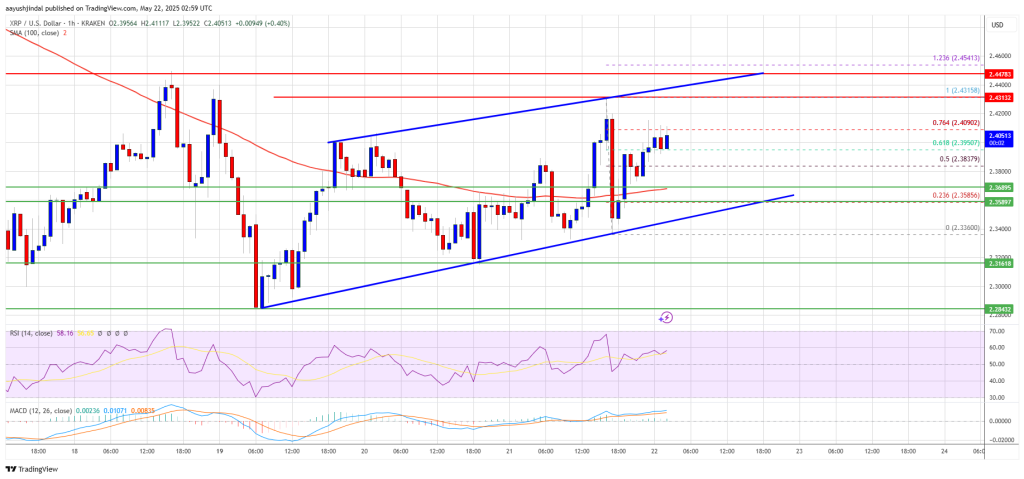
A low was formed at $2.33360 and the price is now moving higher. There was a move above the $2.350 and $2.3650 levels. The price cleared the 50% Fib retracement level of the downward move from the $2.4315 swing high to the $2.3360 high.
The price is now trading above $2.38 and the 100-hourly Simple Moving Average. There is also a connecting bullish trend line forming with support at $2.3580 on the hourly chart of the XRP/USD pair.
On the upside, the price might face resistance near the $2.410 level. It is close to the 76.4% Fib retracement level of the downward move from the $2.4315 swing high to the $2.3360 high. The first major resistance is near the $2.4320 level.

The next resistance is $2.450. A clear move above the $2.450 resistance might send the price toward the $2.50 resistance. Any more gains might send the price toward the $2.550 resistance or even $2.5650 in the near term. The next major hurdle for the bulls might be $2.650.
Another Decline?
If XRP fails to clear the $2.450 resistance zone, it could start another decline. Initial support on the downside is near the $2.3650 level. The next major support is near the $2.3580 level and the trend line
If there is a downside break and a close below the $2.3580 level, the price might continue to decline toward the $2.320 support. The next major support sits near the $2.2650 zone.
Technical Indicators
Hourly MACD – The MACD for XRP/USD is now gaining pace in the bullish zone.
Hourly RSI (Relative Strength Index) – The RSI for XRP/USD is now above the 50 level.
Major Support Levels – $2.3580 and $2.320.
Major Resistance Levels – $2.420 and $2.450.