Technical Indicator Shows Ongoing Rally For Dogecoin Despite Bearish Developments

Dogecoin is holding firm above major support at $0.22 despite repeated threats to break below in the just concluded week. Amidst these fluctuations, an interesting technical indicator suggests that Dogecoin’s long-term rally is still intact.
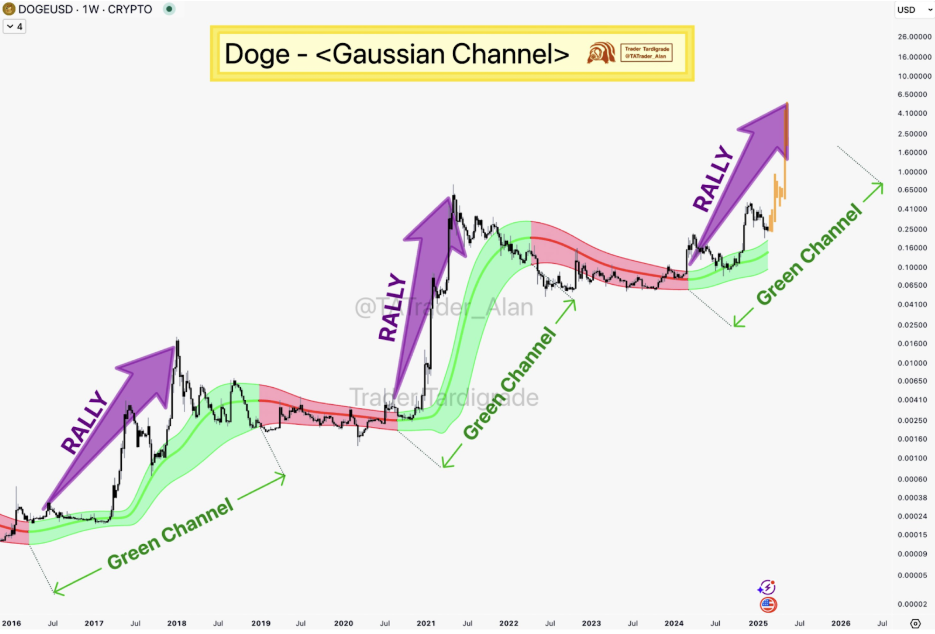
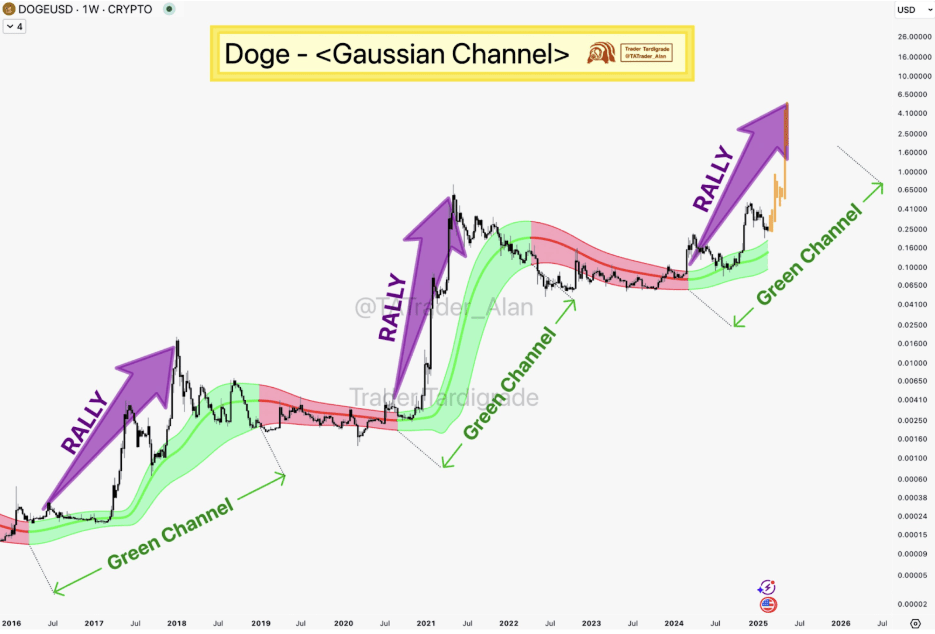
This technical indicator’s outlook was pointed out by crypto analyst Trader Tardigrade, who used the Gaussian Channel, a popular momentum tool, as evidence that Dogecoin’s bullish momentum is still in play despite the current selling pressures.
Gaussian Channel Shows Continued Bullish Strength For Dogecoin
Dogecoin’s price trajectory has been highlighted by a decline since mid-January. This decline has seen Dogecoin fall by as high as 47% from a lower high of $0.4159 on January 18. The price correction is even more pronounced when considering its multi-year high of $0.475, which it achieved on December 9, 2024, from which Dogecoin has now corrected by approximately 54%.
This notable correction has also seen the development of a few bearish signals on the Dogecoin price chart. One such bearish development is the rejection at a macro resistance and the failure to reclaim the macro golden pocket in the recent week.
However, despite the notable correction in the Dogecoin price, the meme coin seems to be still trading in an uptrend in the longer term. This long-term outlook is revealed through the analysis of Dogecoin on the weekly candlestick timeframe using the Gaussian Channel.
The Gaussian Channel is a lesser-known technical analysis tool that helps identify trends and cycles in price movements by highlighting green and red zones in different market cycles. The green zones represent periods of upward momentum, where the price is expected to keep growing. On the other hand, red zones indicate periods of correction or consolidation, during which the market pauses before resuming its upward trajectory.
According to a Dogecoin price chart shared by crypto analyst Trader Tardigrade on social media platform X, Dogecoin entered into its most recent green zone on the Gaussian Channel in 2024. However, despite the recent correction, it has remained in this green zone, indicating that Dogecoin’s uptrend is still active in the long term.

Image From X: Trader Tardigrade
Long-Term Price Target For DOGE
With the Gaussian Channel still indicating the green zone for Dogecoin, the rally could resume anytime soon. According to Trader Tardigrade’s projection, this rally will be enough to push DOGE above multiple resistance levels at $0.3, $0.4, and the recent multi-year high of $0.475.
If momentum builds and buying pressure increases, Dogecoin may even retest its all-time high of $0.7316, which has remained unchallenged since the peak of the 2021 bull run.
Beyond these immediate targets, Tardigrade’s analysis suggests that the meme coin’s long-term trajectory could extend well beyond the $1 mark. The forecast envisions an even more aggressive rally that could see Dogecoin climbing as high as $4.1. At the time of writing, Dogecoin is trading at $0.247, up by 1.5% in the past 24 hours but down by 25% since the beginning of February.
Featured image from TheStreet, chart from TradingView