This is why I believe the bottom has been reached in BTC according to my own on-chain, sentiment and chart analysis.
| |
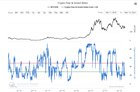
Lets start by saying this post is not hopium and I'm just saying BTC has a high chance of doing well the following months. I'm no gene so I don't have a price prediction like all the incredibly wise investors out there on internet. All I can say is listen, things are looking good. Firstly, why have we had a 45% rally upwards since the 24th of January? The reason is because we hit a bottom. Fear and Greed Index The indicator is the blue graph Some of you may have heard about this indicator, but for those of you who haven't: it measures the fear and greed in the crypto space. When there are reading of above 75 we are in territory of extreme greed and when there are readings of below 25 we are in extreme fear. Now I'm going to smooth out this indicator by putting it as a 50-Period Moving average (each point in the graph is the average of the last 50 days) The indicator is the green graph We have only had these reading of extreme fear 4 other times and all of those times the long term gains were exceptional. Nasdaq 100 Market Breadth Orange chart is the market breadth. Behind is the BTC chart The Nasdaq 100, or it's abbreviation NDX or Nasdaq, is highly correlated to BTC. The Nasdaq's market breadth are all the stocks in the Nasdaq that are moving above the 200 day moving average. All you need to know about this indicator for now is that it can time bottoms when it is oversold, meaning it has a very low reading, lower than 40. In this chart I have vertical lines when there are oversold readings. Each time we get to those readings it has marked a bottom in BTC! Here I have taken out the market breadth chart and I have left the vertical lines with the percentage gains the following months or year. I have taken out the percentage gains of 2014 because I don't count that those are aplicable today. The average gain is about 200% but I wouldn't pay much attention to this since I took different time intervals Total Transfer Volume in Loss This on-chain data shows when investors are selling at a loss. This means that when this indicator goes up a lot, many investors are selling at a loss, and vice versa. When this indicator spikes it usually corresponds to bottoms. If you look closely there are a few discrepancies, but there has been a bottom most of the big spikes. This indicator doesn't time the bottom exactly, but the more it goes up the more likely you are to reach the bottom. This last spike was insanely high meaning there was a high chance for a bottom.
Nasdaq and BTC Correlation:As I said before BTC is highly correlated to Nasdaq, and I'm going to show it here with a chart of both of these assets. Yellow chart is BTC. The other chart is Nasdaq As you can see they are pretty correlated (not always but usually). When we had the last rally, the Nasdaq also had a really nice rally and as it was approaching a resistance (red horizontal line) it corrected and so did BTC. The Parallel Lines Galore This chart shows a bunch of parallel lines which you can draw by drawing a line between the top of the 2018 bull run and the 2021 bull run and then if you are using Tradingview for the charts you click on the line and click CTRL and drag it to points of resistance or support (basically where there have been reactions and the price has changed, for example a local top or bottom) This creates a bunch of channels between where the price of BTC moves and it can help you time good buying opportunities. It can also prepare to where there will be selling pressure, but I will insist on this DO NOT SELL IF IT HITS THE TOP PART OF A CHANNEL, you can easily get rekt, and why the fuck would you ever sell BTC, jk do whatever you want. I highlighted the channel where we are currently and the the red line is the resistance above us which we just fell 16% down from.
As you can see in this image "buy" is the top trending keyword. In crypto platforms. Just look at this sub, I've already seen several people talking about buying the dip. Be fearful when others are greedy and greedy when others are fearful I personally wouldn't worry timing the market, but I just put this out there just showing that there can be FOMO in dips. I'm not saying we will continue to dip. But personally, I wouldn't put all my eggs in one basket and just DCA. Also, we all know how far BTC dips can go… (up to -30% in up trends usually). There are some other metrics that I could mention but this post is already becoming to long, so I'm not going to get in to them. TL;DR: Fear and greed index was in really extreme fear, Nasdaq 100 market breadth was oversold, Total Transfer Volume in Loss of investors has spiked really high, so we have probably seen the bottom. Nasdaq 100 is correlated to BTC. You can draw some pretty parallel lines on tradingview to try and get some good buying opportunities, but this isn't that necessary. These corrections have been normal and healthy and dumb money (retail) is buying todays dip, which is not good. So basically it's a good time to buy BTC because there is a high chance for it to go up long term and mid term, short term who the fuck cares. My recommendation would be to DCA to ovoid possibly some choppy seas. Edit1: When I meant DCA I mean DCA in the following weeks. Sorry not to clarify. Edit2: Of course always DCA is never bad, but a more significant chunk these few weeks submitted by /u/jasomniax |