Bitcoin STH-SOPR Falls Below 1.0 for the First Time Since April – What This Means
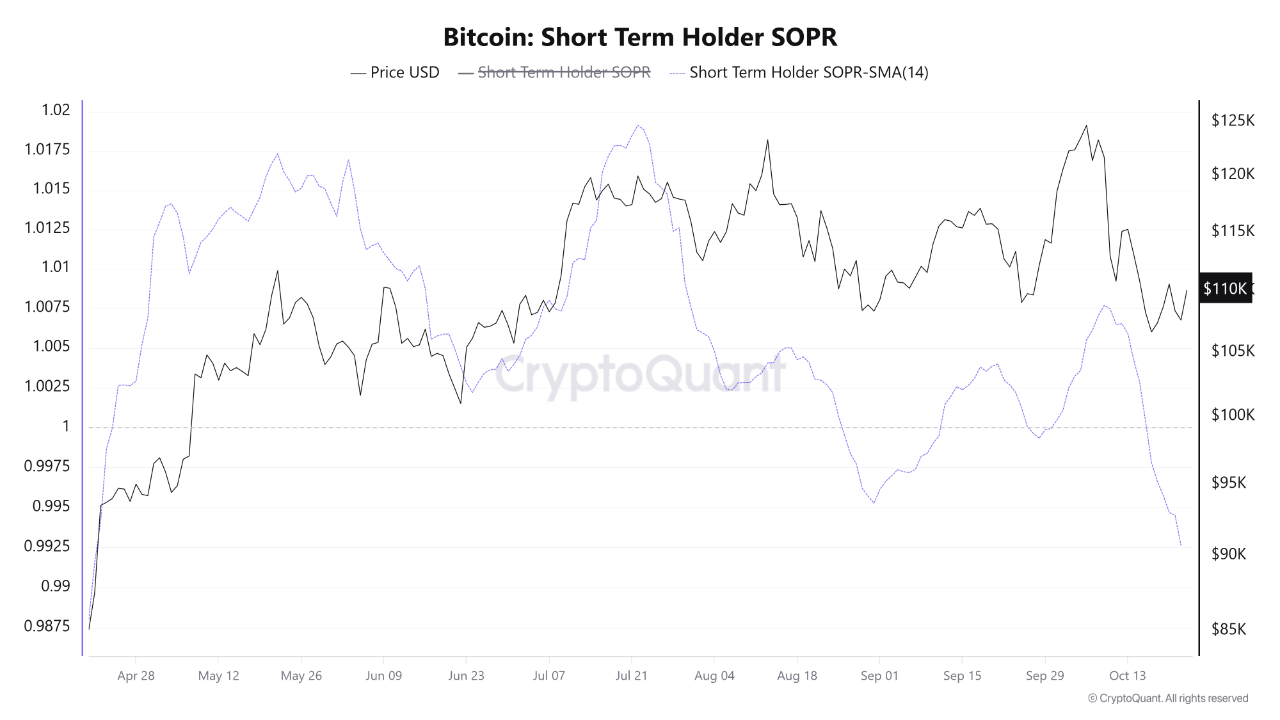
Bitcoin is showing signs of renewed weakness as short-term investors begin to fold under selling pressure. According to the latest data from CryptoQuant, the Short-Term Holder Spent Output Profit Ratio (STH-SOPR) has fallen to 0.992, its lowest level since late April. This key on-chain metric tracks the average profit or loss realized by Bitcoin holders who have owned their coins for less than 155 days — a group often associated with speculative or reactive behavior.
When the STH-SOPR dips below 1.0, it indicates that these holders are selling their coins at a loss, signaling a wave of capitulation and rising fear among newer market participants. The current value implies an average loss of 0.8%, reflecting a notable shift in sentiment after weeks of volatile price action.
Historically, such phases of short-term capitulation often mark moments of emotional exhaustion, where retail traders give up amid uncertainty. While this can reinforce short-term bearish pressure, it also tends to precede market stabilization — as weaker hands exit and long-term investors absorb supply.
Bitcoin STH-SOPR Signals Short-Term Weakness and Long-Term Opportunity
According to CryptoOnchain’s latest insights shared on CryptoQuant, Bitcoin’s Short-Term Holder Spent Output Profit Ratio (STH-SOPR) remains below the crucial 1.0 threshold, reinforcing a bearish short-term outlook. As long as both the STH-SOPR and its 14-day moving average stay under this key level, the indicator acts as a form of resistance — reflecting that short-term holders continue selling at a loss. In such conditions, every price rally risks being met with renewed selling pressure, as these investors look to exit positions at break-even or with minimal loss, creating a ceiling for upward momentum.
However, this same behavior can also plant the seeds for a long-term bullish setup. Historically, extended periods of loss realization by short-term holders have coincided with the final stages of market corrections. This process — often described as a “cleansing” phase — shakes out weak hands and redistributes Bitcoin to long-term holders who are less sensitive to short-term volatility. When capitulation reaches its peak, it often signals the market is approaching “maximum pain”, a point that tends to precede strong recoveries.
While Bitcoin’s current structure suggests ongoing weakness, this phase could also mark the foundation of the next uptrend. Traders should closely monitor the STH-SOPR for a decisive reclaim above 1.0, as that would confirm a shift from loss-driven selling to profit realization — signaling renewed market strength and the potential start of a new bullish phase.
Bears Defend Resistance, Bulls Struggle to Reclaim Momentum
Bitcoin is currently trading around $109,400, showing a modest rebound but still facing strong resistance at higher levels. As seen in the 1-day chart, BTC remains trapped below both the 50-day and 100-day moving averages, which are now converging near $112,000–$114,000 — a zone that has repeatedly acted as supply during recent recoveries.

The 200-day moving average, positioned around $106,000, continues to provide short-term support. However, the repeated retests of this level suggest weakening buyer strength. The inability to sustain a close above $110,000 highlights persistent selling pressure, with traders preferring to de-risk amid broader market uncertainty.
If Bitcoin manages to reclaim $112,000, momentum could shift toward $117,500, the key horizontal resistance and previous range high. A decisive breakout above this level would invalidate the recent bearish structure and open the path toward $123,000.
On the downside, failure to hold the $106,000–$107,000 support range could expose BTC to further downside risk, with potential targets near $102,000 or even $98,000 if selling accelerates.
Featured image from ChatGPT, chart from TradingView.com