Ethereum Faces TD Sell Signal At Key Resistance—$4,100 Next?
An analyst has pointed out how Ethereum has seen a sell signal on the Tom Demark (TD) Sequential alongside the retest of a key resistance line.
Ethereum Is Trading Around Upper Boundary Of Descending Channel
In a new post on X, analyst Ali Martinez has talked about how Ethereum is looking from a technical analysis (TA) perspective. First, Martinez has pointed out that ETH has been trading inside a Descending Channel for the last couple of months.
The Descending Channel refers to a consolidation pattern that forms whenever an asset’s price travels between two parallel lines that are sloped downward. It’s a type of Parallel Channel.
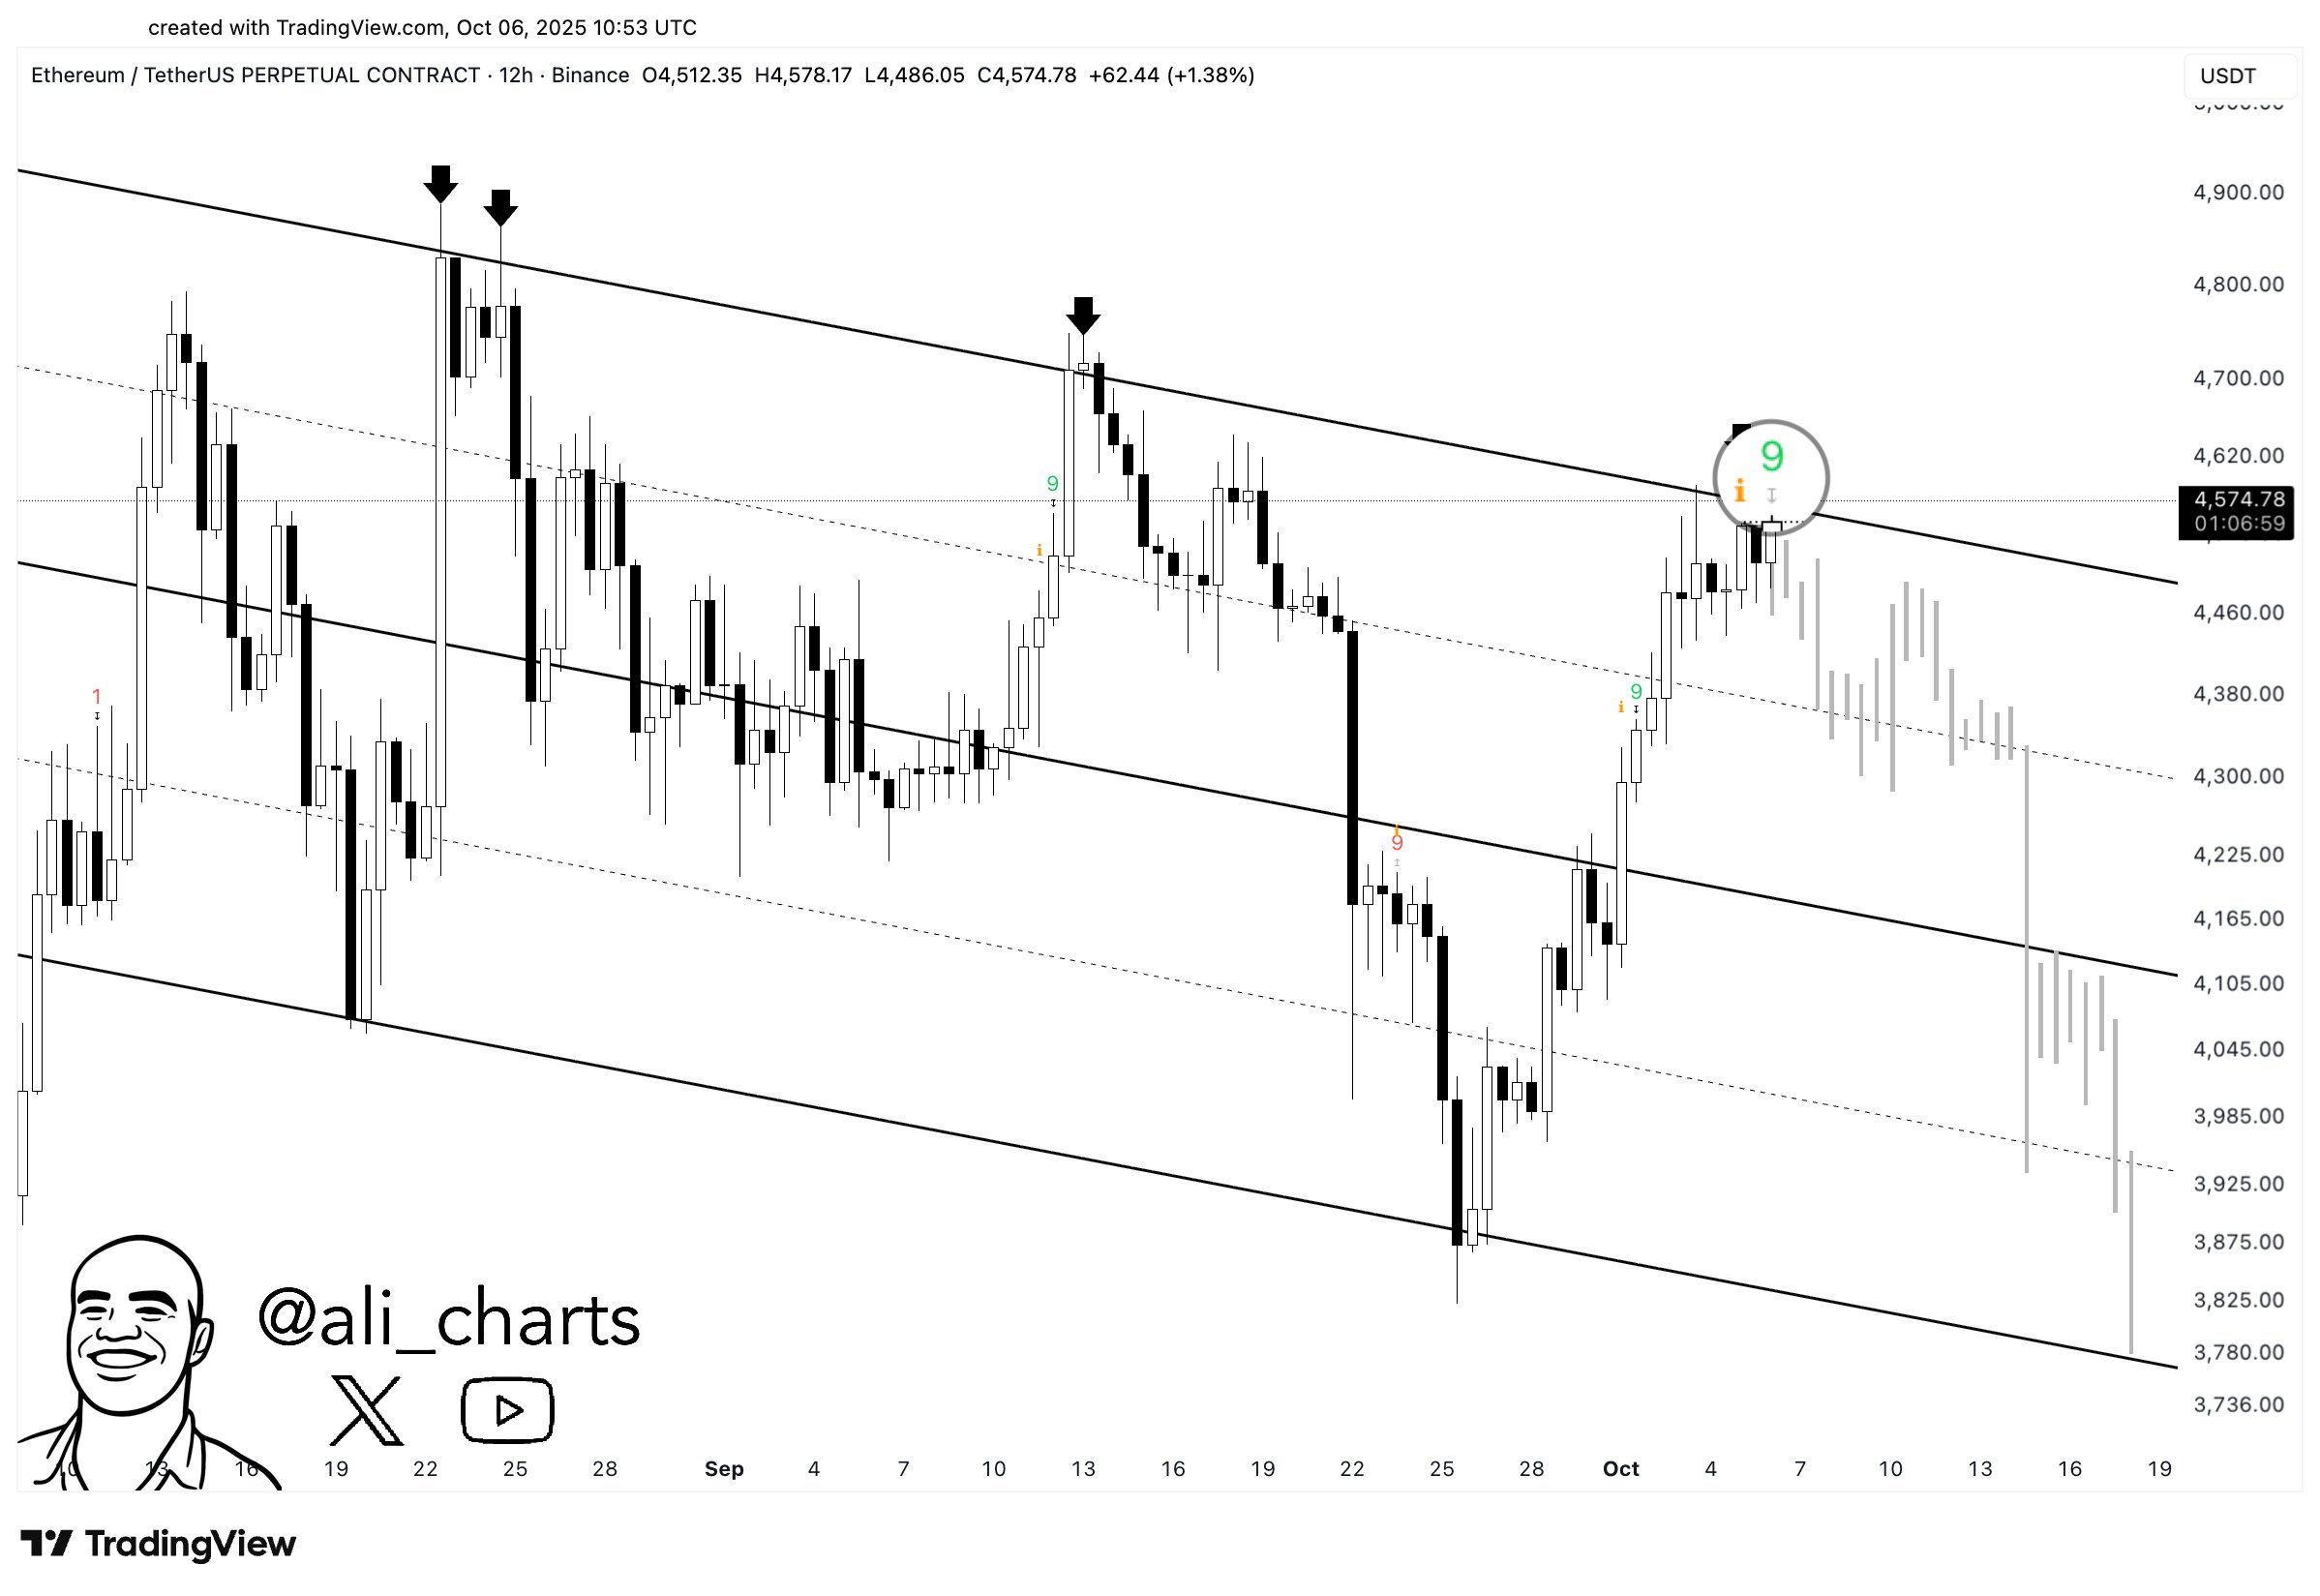
Below is the chart shared by the analyst that shows the Descending Channel for Ethereum’s 12-hour price.
From the graph, it’s visible that Ethereum fell toward the lower level of the Descending Channel in late September, but found support at it and rebounded back up. The lower boundary of all Parallel Channels is assumed to be a source of support, so this would fit with the pattern.
Since the rebound, ETH has made its way back up to the upper boundary of the channel. At the time Martinez made the post, the coin was just retesting it, but it has since added to its gains and is now looking to achieve a sustainable break past the resistance.
Ethereum has made three attempts at breaking this barrier in the last two months, so it only remains to be seen whether the latest move above the line will last. Something that could make the sustainability of the rally harder is another TA alert that has appeared for the asset: a TD Sequential signal.
TD Sequential is an indicator that’s generally used for locating potential points of reversal in any asset’s price. It involves two phases, called the setup and countdown. In the former of these, the indicator counts candles of the same color up to nine. Once these nine candles are in, it gives a top or bottom signal, depending on the color of the candles.
The countdown picks off right where the setup ends and runs the count for another round, except this time it measures thirteen candles, not nine. Following these thirteen candles, the coin could be considered to have reached another turnaround.
The latest TD Sequential signal in Ethereum has come after nine green candles, meaning that from the perspective of the indicator, bullish trend may be reaching a state of exhaustion.
With both the resistance and this signal looming over ETH’s head, the rally could face a challenge. Based on where the midline and bottom line of the Descending Channel lie, the analyst says, “a rejection here could send Ethereum to $4,100 or even $3,780.”
ETH Price
At the time of writing, Ethereum is trading around $4,730, up almost 13% over the last week.