Bitcoin Data Shows Accumulation Prevails As LTH Selling Pressure Eases
Bitcoin is trading at a decisive point after recently setting new all-time highs, but momentum appears to be shifting. Despite briefly pushing past $120,000, BTC failed to sustain levels above its record, and the breakout above ATH remains unconfirmed. This lack of follow-through has fueled bearish speculation, with some analysts warning that the market could be facing increased downside risk in the short term.
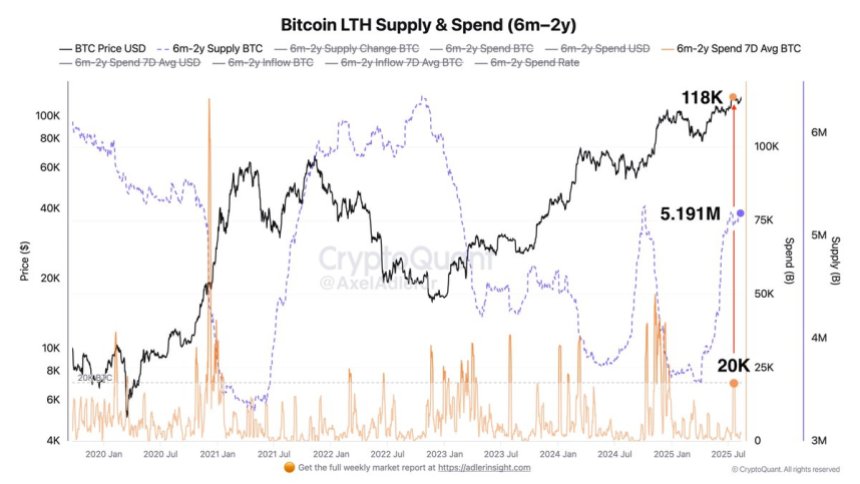
At the same time, on-chain data paints a more constructive picture for long-term stability. According to the latest insights, the Long-Term Holder (LTH) cohort—those holding Bitcoin between six months and two years—has significantly increased its supply. Since April, when BTC was trading at $83,000, their holdings have grown from 3.551 million BTC to 5.191 million BTC, a remarkable increase of 1.64 million BTC.
This accumulation suggests strong conviction among seasoned investors, even as short-term volatility challenges the market. While traders focus on whether Bitcoin can reclaim $120,000 and establish a firm breakout, the ongoing buildup by long-term holders reinforces the broader bullish structure. The clash between short-term weakness and long-term strength will likely define Bitcoin’s next major move.
Bitcoin Long-Term Holders Signal Strength
According to top analyst Axel Adler, Bitcoin’s latest test of the all-time high at $118,000 showed a very different behavior compared to past cycles. During this move, long-term holders (LTHs) who have been holding coins between six months and two years engaged in some profit-taking. Data reveals their seven-day average spending climbed to 20,000 BTC. However, this level is far below the typical distribution spikes of previous cycles, where spending often surged to between 40,000 and 70,000 BTC.
This more moderate selling activity suggests that the conviction among long-term holders remains strong. Rather than aggressively taking profits, many are choosing to continue accumulating or simply holding their positions. Adler highlights that accumulation still outweighs distribution, reflecting confidence in the market’s future direction. Such behavior from experienced participants typically signals a healthier, more sustainable bull phase, where selling pressure is absorbed without disrupting the broader uptrend.
Despite this encouraging backdrop, Bitcoin faces a crucial technical test. To confirm the strength of the latest move, BTC needs to decisively push above the $125,000 level. A breakout beyond this resistance would likely validate the resilience shown by long-term holders and open the path toward further price discovery.
If bulls succeed, the combination of institutional demand, long-term accumulation, and reduced selling pressure could drive the next major rally. Conversely, failure to reclaim $125,000 in the near term might give bears room to test lower levels before the next leg up.
Testing Support After ATH Rejection
Bitcoin’s 4-hour chart shows price retreating after a sharp rejection near $123,200, just below the recent all-time high at $124,000. Following this failed breakout attempt, BTC has slipped back toward $117,300, where it is currently holding above the key confluence of the 100 and 200 moving averages.
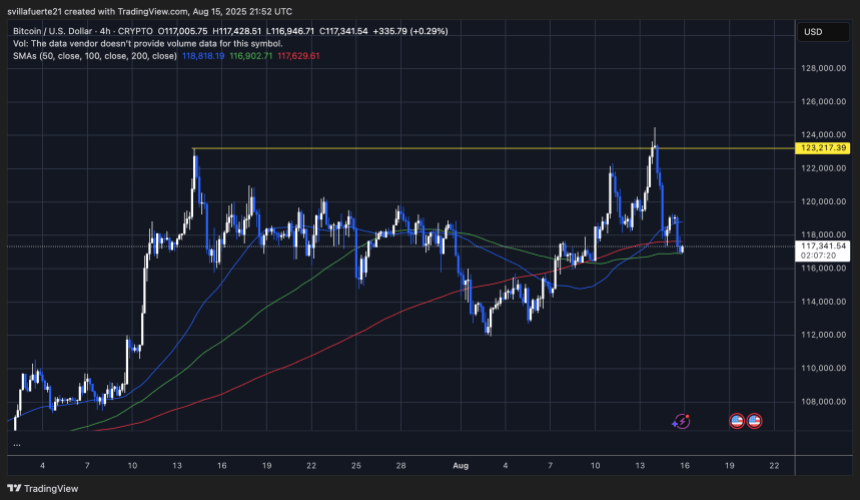
This zone between $116,900 and $117,600 is acting as immediate support. A decisive breakdown here could expose further downside toward $115,000. However, the moving averages continue to slope upward, reflecting an underlying bullish structure despite the short-term weakness.
The repeated rejection at $123,000–$124,000 highlights the importance of this resistance. Bulls will need to reclaim this zone with conviction to confirm momentum and extend the uptrend toward higher levels. Until then, the market remains in a consolidation phase, with traders closely watching if support at the $117K region holds.
Featured image from Dall-E, chart from TradingView