XRP Bullish Cross Playing Out Again: $9 Or $24 Next?
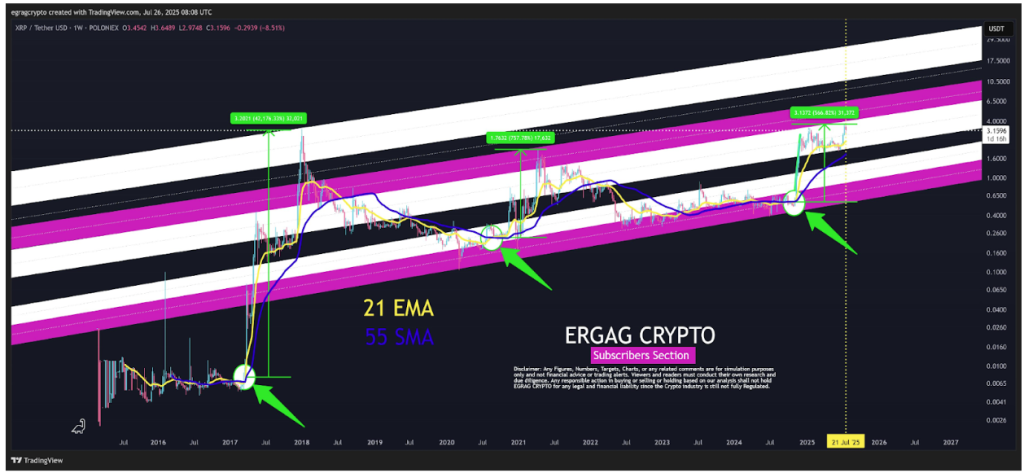
XRP’s technical setup is playing out another major move, and this time the bullish momentum is being backed by the reappearance of one of its most powerful historical indicators. According to a new analysis posted by Egrag Crypto on the social media platform X, XRP’s 21 EMA and 55 SMA weekly crossover has been playing out quite nicely, with XRP recently hitting $3.65 on July 18 before cooling off.
Now, this analysis projects that the pattern may still be in its early stages. Based on historical outcomes, XRP might be on track to reach as high as $9 or even $24.
Bull Crosses Cause Massive Rallies For XRP
EGRAG’s chart, which displays XRP’s weekly price action with the 21 EMA and 55 SMA trendlines, shows that each time a bullish crossover occurred between the two trendlines, it marked the beginning of a strong price rally. The first instance of such a cross was in March 2017, and by the end of that cycle, XRP’s price had reached a peak that represented a 40,000% surge from its low. Then in August 2020, a similar crossover produced a 750% pump before topping out.
The most recent bullish crossover occurred in October 2024 and has so far resulted in a 560% rise from XRP’s bottom in September 2024. However, there was a similar temporary pump in April 2023 that Egrag excluded from his model.
Based on different assumptions about the previous price playout between the two cycles, the analyst outlined two possible targets for the current cycle. The first projection is a 1,500% rally, double that of 2020’s run, which would place the price peak for this cycle at $9. The second projection is a 4,000% rally, which represents just 10% of the massive 2017 spike. This second, more bullish projection places XRP’s price peak anywhere at $24.
Chart Image From X: Egrag Crypto
XRP Drops To Retest $3 After New ATH At $3.65
After reaching a new cycle high of $3.65 on July 18, XRP failed to hold above the $3.21 resistance zone and corrected down to test the $3.00 support level on July 24. The price volatility, although strong, wasn’t enough to break this support level.
Crypto analyst CasiTrades also weighed in on the current technical setup by pointing to an Elliott Wave count that suggests a major third wave is about to begin. In her analysis posted on X, she confirmed that XRP has completed a subwave 2 correction, reaching the deep 0.854 Fibonacci retracement level before bouncing. What’s important here is that the price held above $3, never forming a new low, which is probably now a new price floor.
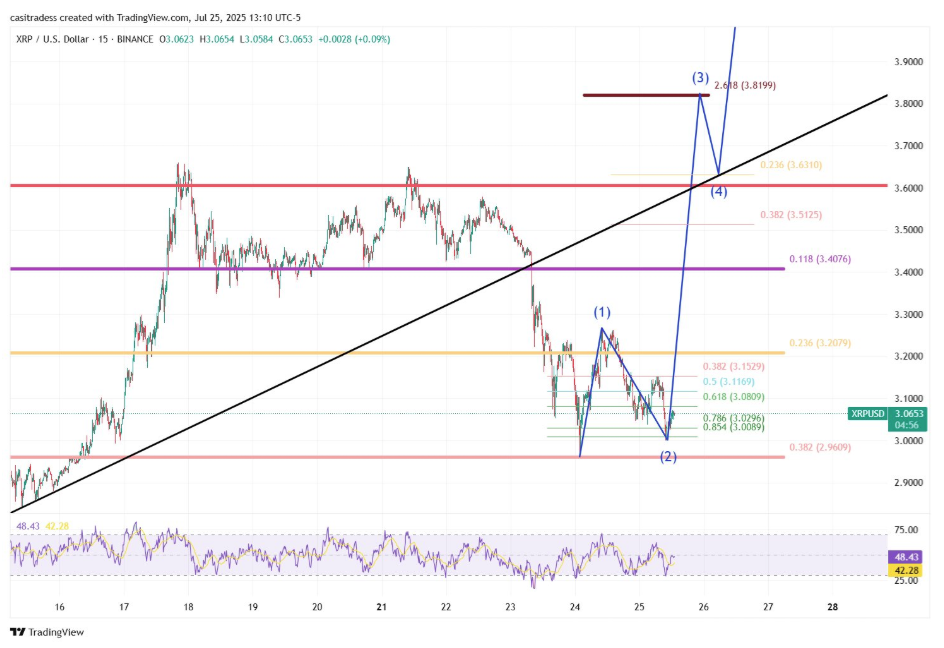
Chart Image From X: CasiTrades
If buying volume increases and XRP regains its hold above $3.21, the next move is to target $3.82, which coincides with the 2.618 Fibonacci extension. Interestingly, the analyst noted that $3.82 also aligns with what many platforms historically recorded as XRP’s new all-time high. Should XRP close a weekly candle above $3.82, it could lead to prices that align with Egrag’s projections.
At the time of writing, XRP is trading at $3.17.
Featured image from Getty Images, chart from TradingView