The Best Indicators for Crypto Trading Signals in 2025
The best indicators for crypto trading signals in 2025 are candlestick chart patterns, trend lines, support and resistance levels, SMA and EMA, stochastic oscillator, Bollinger Bands, RSI, MACD, On-Balance Volume, and Fibonacci retracement and extension.
Crypto trading indicators are tools used in technical analysis to study price movements, trends, and market patterns. These indicators use mathematical formulas based on price, volume, or open interest to help traders predict future market behavior and identify potential entry or exit points. Indicators enable trend detection, entry/exit confirmation, risk management, volatility analysis, and momentum tracking for crypto signals.
This guide will review the 10 best indicators to use for cryptocurrency trading and explain what crypto trading indicators are and why they matter most for crypto trading signals. We will also explain how to effectively combine indicators with an example.
1. Candlestick Chart Patterns
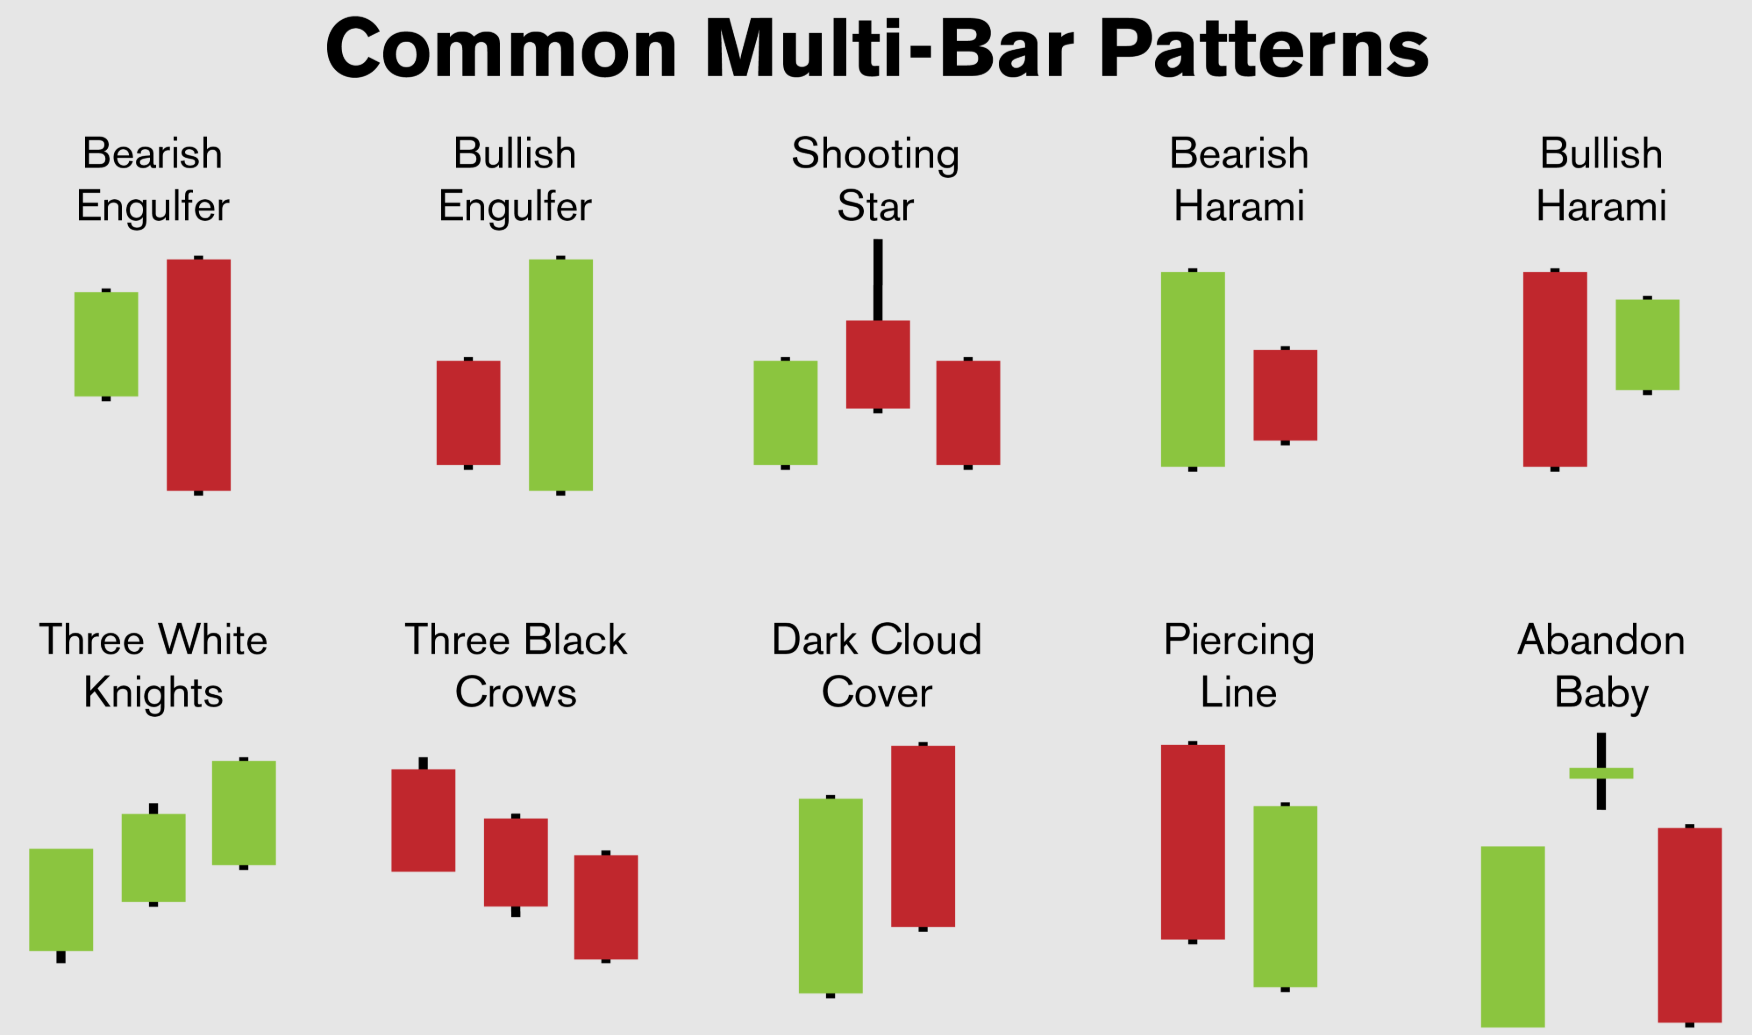
Candlestick charts are a graphical representation of the price movements of cryptocurrencies within particular timeframes. Each candlestick reveals price action within a chosen timeframe, such as a minute, hour, or day.
A candlestick has a “body” and “wicks” (alternatively referred to as shadows). The body shows the range between opening and closing prices.. Therefore, if the closing price is more than the opening price, the body tends to be green or white in color to signify a rise in price. If the closing price is lower than the opening price, the body is typically red, indicating a price decline.
The wicks extend above and below the body, reflecting the highest and lowest prices reached during that period. By analyzing candlestick sequences, traders identify patterns signaling future price action. Common candlestick patterns for crypto trading include doji, spinning tops, shooting stars, and bullish or bearish engulfing patterns.

2. Trend Lines 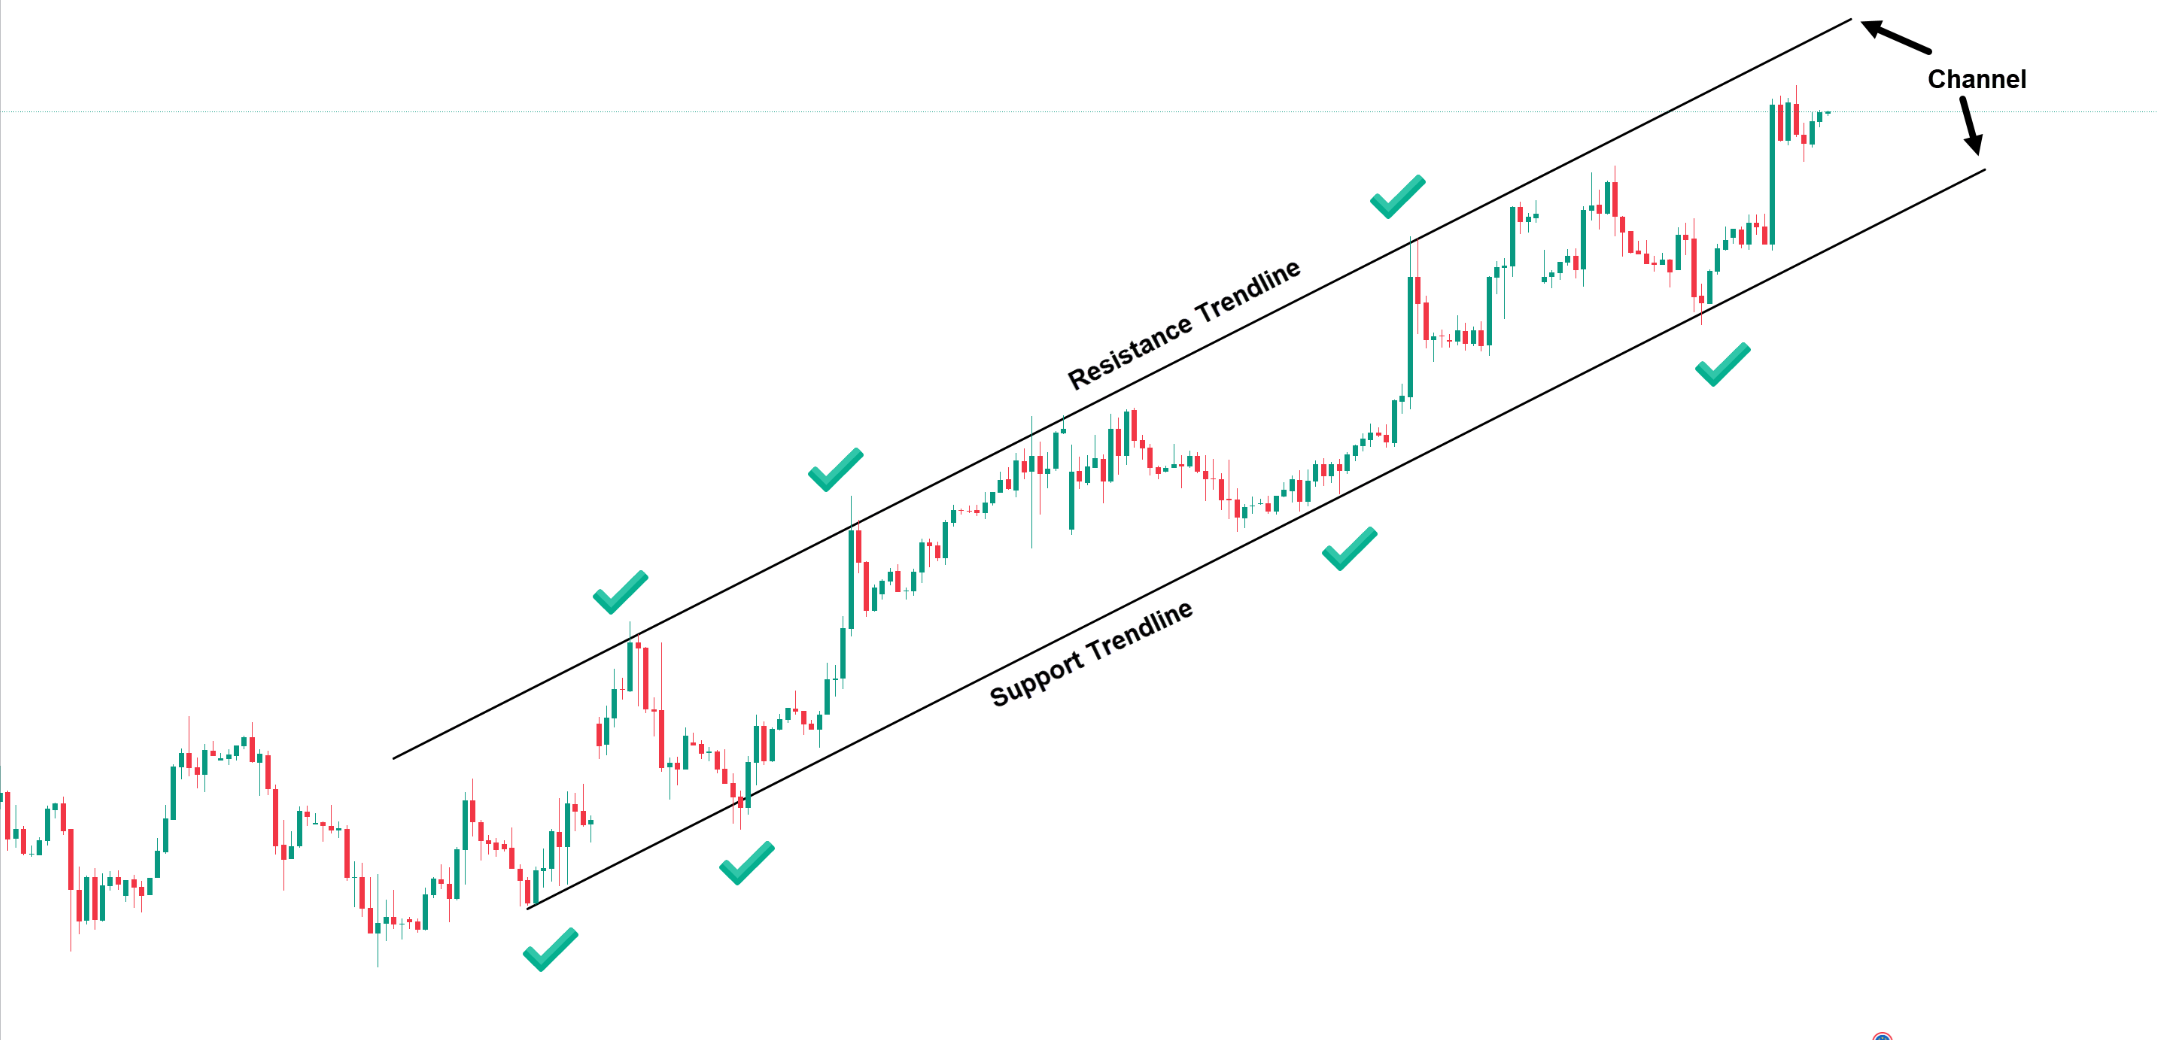
Trend lines are basic technical analysis tools used as graphical representations of the general direction of the price of a cryptocurrency. Trend lines are graphically drawn directly from a chart by linking a sequence of important price levels.
An “uptrend line” is drawn along the bottom of price lows during an upward movement, and this indicates that buyers are in control and pushing prices higher. Conversely, a “downtrend line” connects the tops of price highs during a downward movement, and it signifies that sellers are dominating and driving prices lower.
A sideways or horizontal trend line indicates a consolidation phase with prices fluctuating within a limited range. Traders use trend lines to assess trend strength, detect breakouts, and establish dynamic support or resistance levels.
3. Support and Resistance Levels

Support and resistance levels are key indicators for crypto trading. These levels are important concepts in technical analysis that represent price areas where a cryptocurrency’s trend generally pauses or reverses.
A “support level” is a price level at which buying interest is sufficient to prevent the price from declining further; essentially, it acts as a ”floor”. When the price reaches a support level, it often rebounds due to increased buying interest. A “resistance level” is a price level at which selling interest is robust enough to resist the price from increasing further, acting as a ceiling. These levels form due to market psychology and historical trading patterns.
Support and resistance levels are watched by traders to determine where they may enter and exit, because breaking above resistance can be an indication that the uptrend will continue, while a break below support can signal a downtrend.
4. Simple and Exponential Moving Averages (SMA and EMA)

Moving averages are popular crypto trading indicators that smooth historical price data over a period.
The “Simple Moving Average” (SMA) will calculate the average price the average price of a cryptocurrency over a set number of periods, and it gives equal weight to each data point. So, for example, a 50-period SMA would average the closing prices of the last 50 candles.
The “Exponential Moving Average” (EMA), on the other hand, gives more weight to recent price data, and makes it more responsive to new information and quicker to react to price changes. This responsiveness is highly useful for short-term trading.
Both SMAs and EMAs are used to confirm trends, identify potential support or resistance levels, and generate buy or sell signals for you when shorter-term averages cross over longer-term averages (known as “golden crosses” or “death crosses”). Generally, many traders use a combination of moving averages to have a comprehensive overview of market momentum.
For example, if Bitcoin’s 50-day EMA falls below its 200-day EMA, it may signal bearish momentum. But if the 50-day EMA crosses above the 200-day EMA, it’s called a Golden Cross and may signal a strong uptrend.
5. Stochastic Oscillator

The Stochastic Oscillator is a popular indicator that helps traders figure out if a crypto asset might be “overbought” or “oversold”.
An overbought condition occurs when the price rises rapidly, and it might be due for a little pullback. When it’s oversold, the price has dropped a lot, and it might be ready to bounce back up. This indicator works by comparing a cryptocurrency’s current closing price to its price range over a specific period, usually 14 periods (like 14 days or 14 hours).
It generates two lines, %K and %D, moving between 0 and 100, typically over 14 periods. Here, the key levels to watch are 80 and 20. If both lines go above 80, it’s often a signal that the crypto is overbought. On the flip side, if the lines drop below 20, it suggests the crypto is oversold.
You can also monitor %K line crossovers with the %D line, this can sometimes signal a change in momentum. It’s a good tool for spotting some turning points in price, but generally it’s best used alongside other indicators, as it can sometimes give false signals in strong trends. So, you can try to use it with moving averages or support and resistance levels.
6. Bollinger Bands 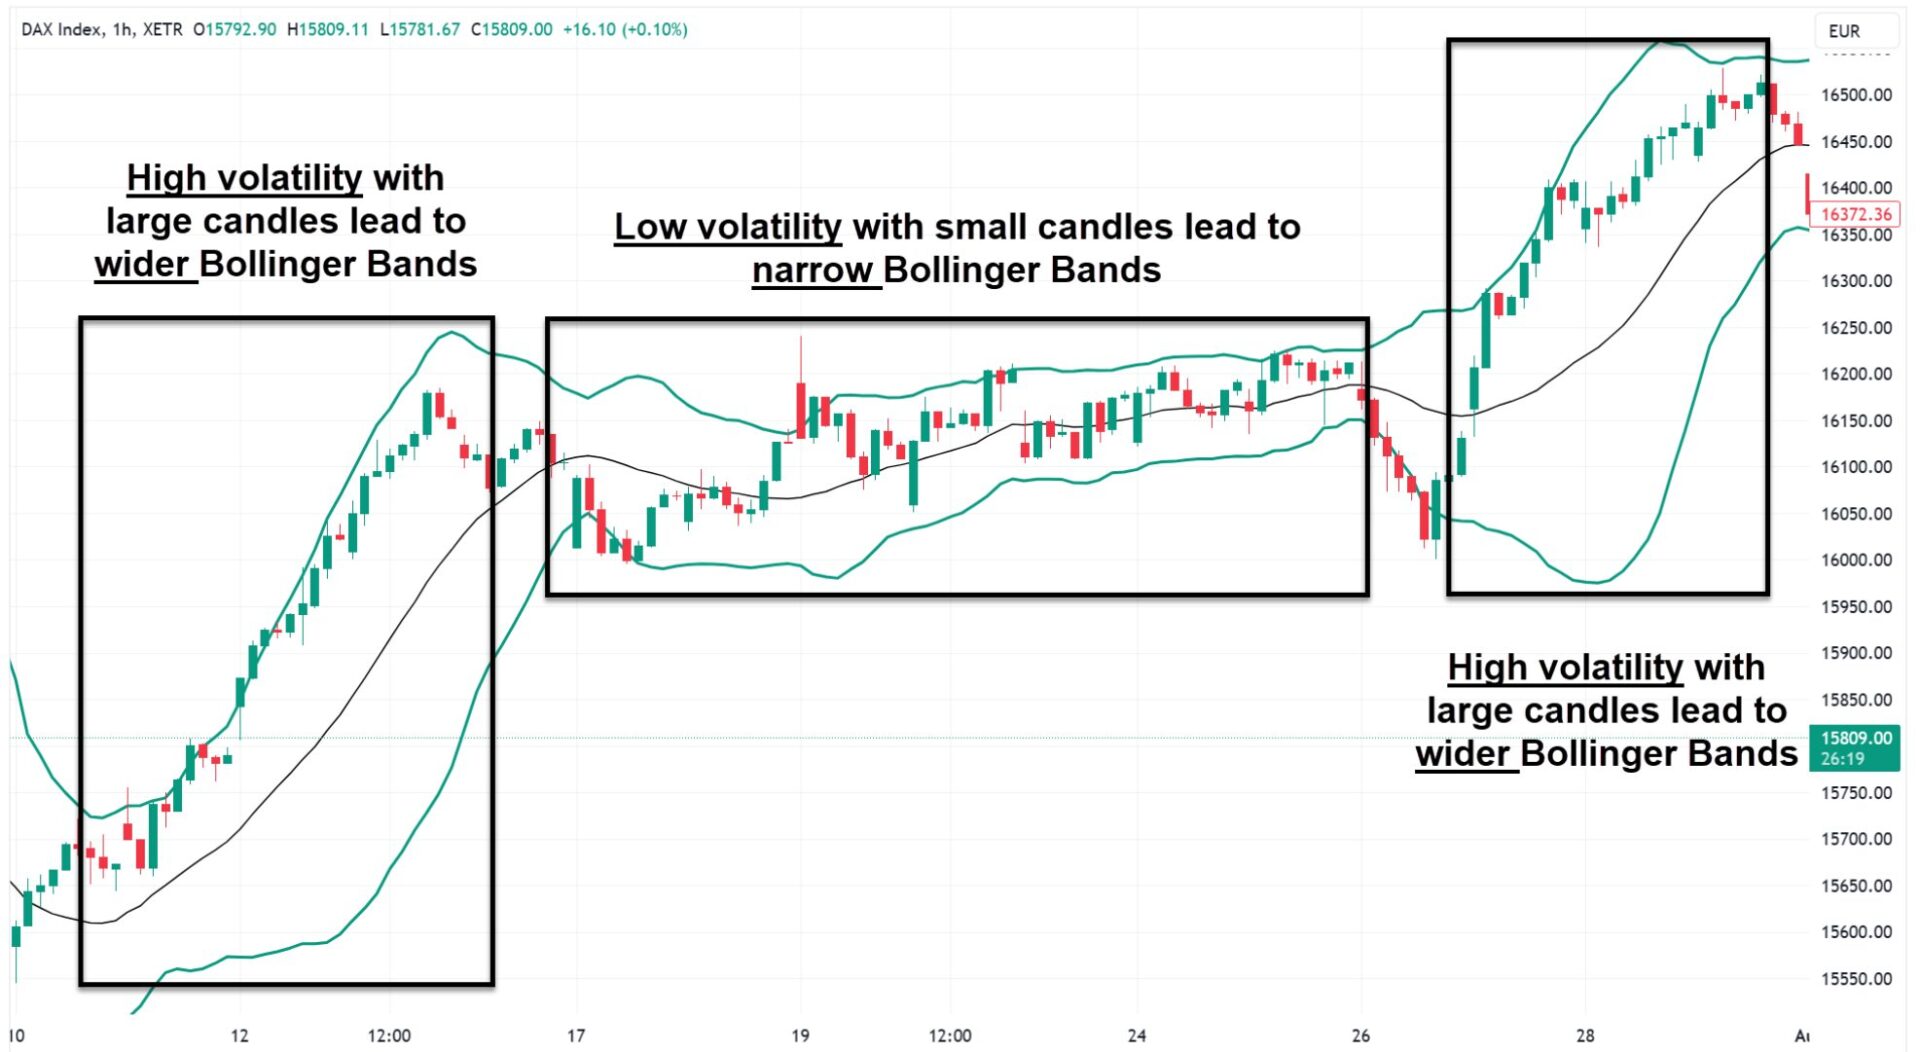
Bollinger Bands consist of three lines: a Simple Moving Average (SMA) in the middle, and an upper and lower band that are set a certain number of standard deviations away from the SMA. Standard deviation measures price volatility relative to the average.
So, when the bands are close together, it tells us that the crypto’s price isn’t moving much; it’s pretty calm, like Bitcoin staying within a narrow range for a few days. This “squeeze” can often indicate a significant price move is imminent soon. And, when the price becomes volatile, the bands expand and show that the price is swinging more widely, perhaps like Bitcoin suddenly having huge price swings up and down.
Traders monitor price touches or breakouts from the bands. For example, if the price touches the upper band, it might be considered overbought in the short term, suggesting a potential pullback. Or, if it hits the lower band, it might be oversold and due for a rebound.
7. Relative Strength Index (RSI)

The Relative Strength Index, or RSI, is another highly effective “momentum oscillator” that helps traders gauge the speed and change of future price movements. RSI compares recent price gains to losses to assess whether a cryptocurrency is overbought or oversold, similar to the Stochastic Oscillator but with a different calculation.
The RSI value ranges from 0 to 100. The key levels to watch with RSI are 70 and 30. If the RSI goes above 70, it typically signals that the crypto is overbought. On the other hand, if the RSI drops below 30, it suggests the crypto is oversold and implies that sellers may be losing momentum, and we can expect some bounce back.
Traders often monitor divergences, where the price reaches a new high but RSI does not, which can be a strong signal of a weakening trend.
8. Moving Average Convergence Divergence (MACD)

The MACD, which stands for Moving Average Convergence Divergence, is a fantastic trend-following momentum indicator. It’s designed to reveal changes in the strength, direction, momentum, and duration of a trend in a cryptocurrency’s price. The MACD has three main components: the MACD line, the signal line, and the histogram.
The MACD line results from subtracting a longer-term EMA from a shorter-term EMA (commonly the 12-period EMA minus the 26-period EMA). The signal line is usually a 9-period EMA of the MACD line itself. The histogram reflects the difference between the MACD line and the signal line.
Traders focus on MACD line crossovers with the signal line. For example, if the MACD line crosses above the signal line, it’s often seen as a bullish signal and suggests some upward momentum. Conversely, if the MACD line crosses below the signal line, it signals bearish momentum. Again, the histogram expanding indicates increasing momentum in that direction, while contracting suggests weakening momentum.
9. On-Balance Volume

On-Balance Volume, or OBV, is a cumulative total of trading volume, which means it adds up all the trading activity over time. Here’s how it works: if a crypto’s price goes up, that day’s trading volume is added to the OBV total. If the price goes down, that day’s volume is subtracted. If the price stays the same, the OBV doesn’t change.
OBV suggests that volume changes may precede price movements. If the OBV rises while the price remains stable or slightly declines, it may signal that big buyers are quietly stepping in, and the price might follow soon. On the flip side, when the OBV is falling and the price is holding steady, sellers are quietly leaving, and the price might drop soon.
10. Fibonacci Retracement and Extension

Fibonacci Retracement and Extension are tools based on a special series of numbers (the Fibonacci sequence) that appear often in nature and, surprisingly, in financial markets. Traders use these tools to find potential price levels where a crypto might “retrace” (often called a pullback) during a trend or where it might extend to if it continues its move.
Fibonacci Retracement is very helpful in finding potential support and resistance levels when a price is pulling back from a strong move. For example, if Bitcoin surges upward, then traders will draw Fibonacci retracement levels (like 23.6%, 38.2%, 50%, 61.8%, and 78.6%) from the bottom of that move to the top. These percentages are based on the Fibonacci sequence. The idea is that the price will often find some temporary support or resistance at these specific levels before continuing its original trend. So, if Bitcoin goes up a lot and then starts to drop after some time, it might find support around the 38.2% or 50% retracement levels and then go back up again.
Fibonacci Extension is used to predict potential price targets beyond the initial price movement, once a retracement is complete. So, after a crypto pulls back to a retracement level and then starts moving in its original direction, extension levels (like 123.6%, 161.8%, 200%, etc.) can give traders an idea of how far the price might go. Traders often target the 161.8% extension level.
What Are Crypto Trading Indicators?
The crypto trading indicators are tools used for technical analysis to understand price movements in the crypto market. These indicators help traders analyze charts, identify trends, and determine buy or sell points. They rely on historical price, volume, open interest, or market patterns.
Generally, indicators fall into two main categories. Leading indicators predict price movements. And the second category is lagging indicators, which confirms past trends.
In 2025, top indicators for crypto trading signals include candlestick patterns, trend lines, support and resistance levels, SMA and EMA, stochastic oscillator, Bollinger Bands, RSI, MACD, On-Balance Volume, and Fibonacci retracement and extension.
Why Indicators Matter for Crypto Trading Signals?
Indicators are crucial for crypto trading signals, providing actionable insights that tell a trader it might be a good time to buy or sell a cryptocurrency. Each indicator has its own way of showing these hints. For example, an RSI below 30 signals an oversold cryptocurrency, which could be a buy signal for some traders.
What Are the Best Trading Indicators for Crypto?
The best trading indicators for crypto are candlestick chart patterns, trend lines, support and resistance levels, SMA and EMA, stochastic oscillator, Bollinger Bands, RSI, MACD, On-Balance Volume, and Fibonacci retracement and extension.
What Are the Best Technical Indicators for Day Trading Crypto?
The best technical indicators for day trading crypto are the Relative Strength Index (RSI), the Moving Average Convergence Divergence (MACD), and Bollinger Bands.
The RSI is great because it helps you quickly see if a crypto is overbought or oversold. Since day trading involves frequent small moves, identifying extreme points is critical. The MACD is another essential. It’s good for spotting changes in momentum. When its lines cross, it can give you a quick signal that the trend might be changing, which is super useful for getting in or out of trades fast. And then there are Bollinger Bands, which effectively indicate price volatility and potential breakouts. If the bands squeeze together, it often means a big move is coming, and that’s exactly what day traders look for.
Why Day Trading Needs Specific Indicators?
Day trading needs specific indicators because they help with speed, precision, risk management, and filtering noise.
- Speed: Day traders handle price changes occurring within minutes or seconds. You’re not holding onto crypto for days or weeks. Because of this speed, you need indicators that react instantly to what’s happening right now. If an indicator is slow to update, you’ll miss the small opportunities to buy low and sell high according to your trading strategies. Also, learn about Telegram trading bots for fast trading.
- Precision: Compared to long-term investing, where you wait for significant price increases, day traders are even happy with small gains many times a day. So, to grab these tiny profits, indicators must detect minor momentum shifts or short-term overbought/oversold conditions.
- Risk Management: Day trading comes with higher risks because of the quick moves. You need indicators that can help you decide when to get out of a trade just as fast as you got in, whether it’s to take a small profit or cut a small loss.
- Filtering Noise: Price charts can look very messy with lots of ups and downs, and this is often seen on short timeframes. Day trading indicators smooth out market noise, highlighting key signals. They will help you focus on the most relevant information for very short periods.
How to Effectively Combine Indicators?
To effectively combine indicators, you need to combine indicators that provide distinct insights, such as trend, momentum, and volume data.. One indicator identifies the trend direction, while another confirms entry or exit points. You can learn more by studying crypto trading signal basics, which leverage these indicators in real-time setups.
The best example of combining technical indicators is using the RSI with MACD and Moving Averages. Traders often look for a scenario where the RSI signals an oversold condition (below 30). This suggests the coin may rise soon. At the same time, they’ll check if the MACD lines are crossing upwards, confirming that momentum is indeed shifting to the upside. And to top it off, they might look for the price to cross above a key moving average, which further confirms a short-term bullish trend.
Note: Avoid combining crypto indicators that show the same type of data, like RSI and Stochastic Oscillator, because they may give similar signals and confuse you. Instead, mix trend, momentum, and volume indicators.
The post The Best Indicators for Crypto Trading Signals in 2025 appeared first on CryptoNinjas.