Bitcoin Buying Timing: War Fears and Market Recovery Analysis
| |
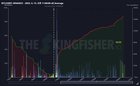
The market has been rattled once more by rising tensions between Iran and Israel. This news was enough to shake the entire asset market, including cryptocurrencies, with Bitcoin briefly threatening the $100,000 mark and altcoins facing steep corrections. It’s a familiar scene—one of recurring fear and doubt. But what does it all truly mean? Looking back, similar conflicts unfolded in April and October 2024. The market reacted with momentary panic and a surge in selling, only to recover swiftly within days. This time appears no different. The fact that fear hasn’t lingered long suggests this is less a structural collapse and more a technical reaction. It’s a clue that there’s more to this than just a price drop—something worth examining beneath the surface. The Iran-Israel conflict has been limited to strategic airstrikes and restrained missile responses, without direct ground confrontation. This points to a localized skirmish rather than an all-out war, likely acting as an event that pauses the market’s existing rhythm rather than redefining its course. In other words, this uncertainty may fade within days rather than persist. Bitcoin Market Analysis: Liquidation Zones and Price Trends on June 15, 2025, by The Kingfisher. This hints that, between collapse and counterattack, the latter is gaining traction. Meanwhile, Ethereum is showing striking momentum, with trading volume and futures open interest hitting all-time highs, suggesting not just a technical bounce but a structural signal of institutional entry. The ETH/BTC ratio further confirms Ethereum’s relative strength, shifting focus from short-term price swings to the potential for a broader transition. The altcoin market tells a bigger story. The OTHERS market cap chart shows it breaking out of a months-long downtrend, now digesting consolidation in the Phase D zone. If this level holds, a return to an upward cycle seems plausible. A Chart Depicting Others Market Capitalization This isn’t a mere bearish turn but a retest of the upper boundary of the prior downtrend channel—a technical validation of support. The TOTAL3 index reinforces this, with the altcoin market’s cycle of surge, correction, support confirmation, and rebreakout still intact, currently poised for its next expansion. Amid this, Coinbase’s inclusion in the S&P 500 marks a symbolic shift. It’s not just a stock update—it’s a structural milestone for the cryptocurrency industry crossing into mainstream acceptance. Wall Street no longer sees digital assets as outliers but as candidates for integration. The door to institutionalization is opening. Ripple, meanwhile, has been quietly consolidating in a box range for 195 days. This prolonged stagnation could precede an explosive breakout in either direction, with the 2.08 level acting as a key support that, if held, might serve as a buying point. Ultimately, the market is swaying in uncertainty, but that uncertainty could fuel the next move. The pattern of war, fear, correction, and rebound has repeated through 2024 and now into June 2025. History suggests these dips often recover quickly, laying the groundwork for fresh rallies. Rather than being paralyzed by fear, it might be worth reading the structure of the flow and preparing for what’s next. Opportunities don’t come often, but when they do, they’re brief and potent. This could be one of those moments. submitted by /u/Silent_Elk7515 |