Bitcoin Rally Hits Wall as Price Stalls Below $104K, Analyst Cites Derivatives Pressure
Bitcoin experienced a notable surge earlier this week, climbing above the $104,000 mark and registering a weekly gain of nearly 10%. However, after reaching this level, the asset appears to have encountered resistance, with upward momentum slowing and price action remaining relatively flat in recent days.
At the time of writing, BTC is trading at $103,663, reflecting a modest 1.7% increase over the past 24 hours. Amid this price performance, one of CryptoQuant’s top analysts, Darkfost, offered insight into the current market stagnation.
Derivatives Market Activity Signals Short-Term Uncertainty
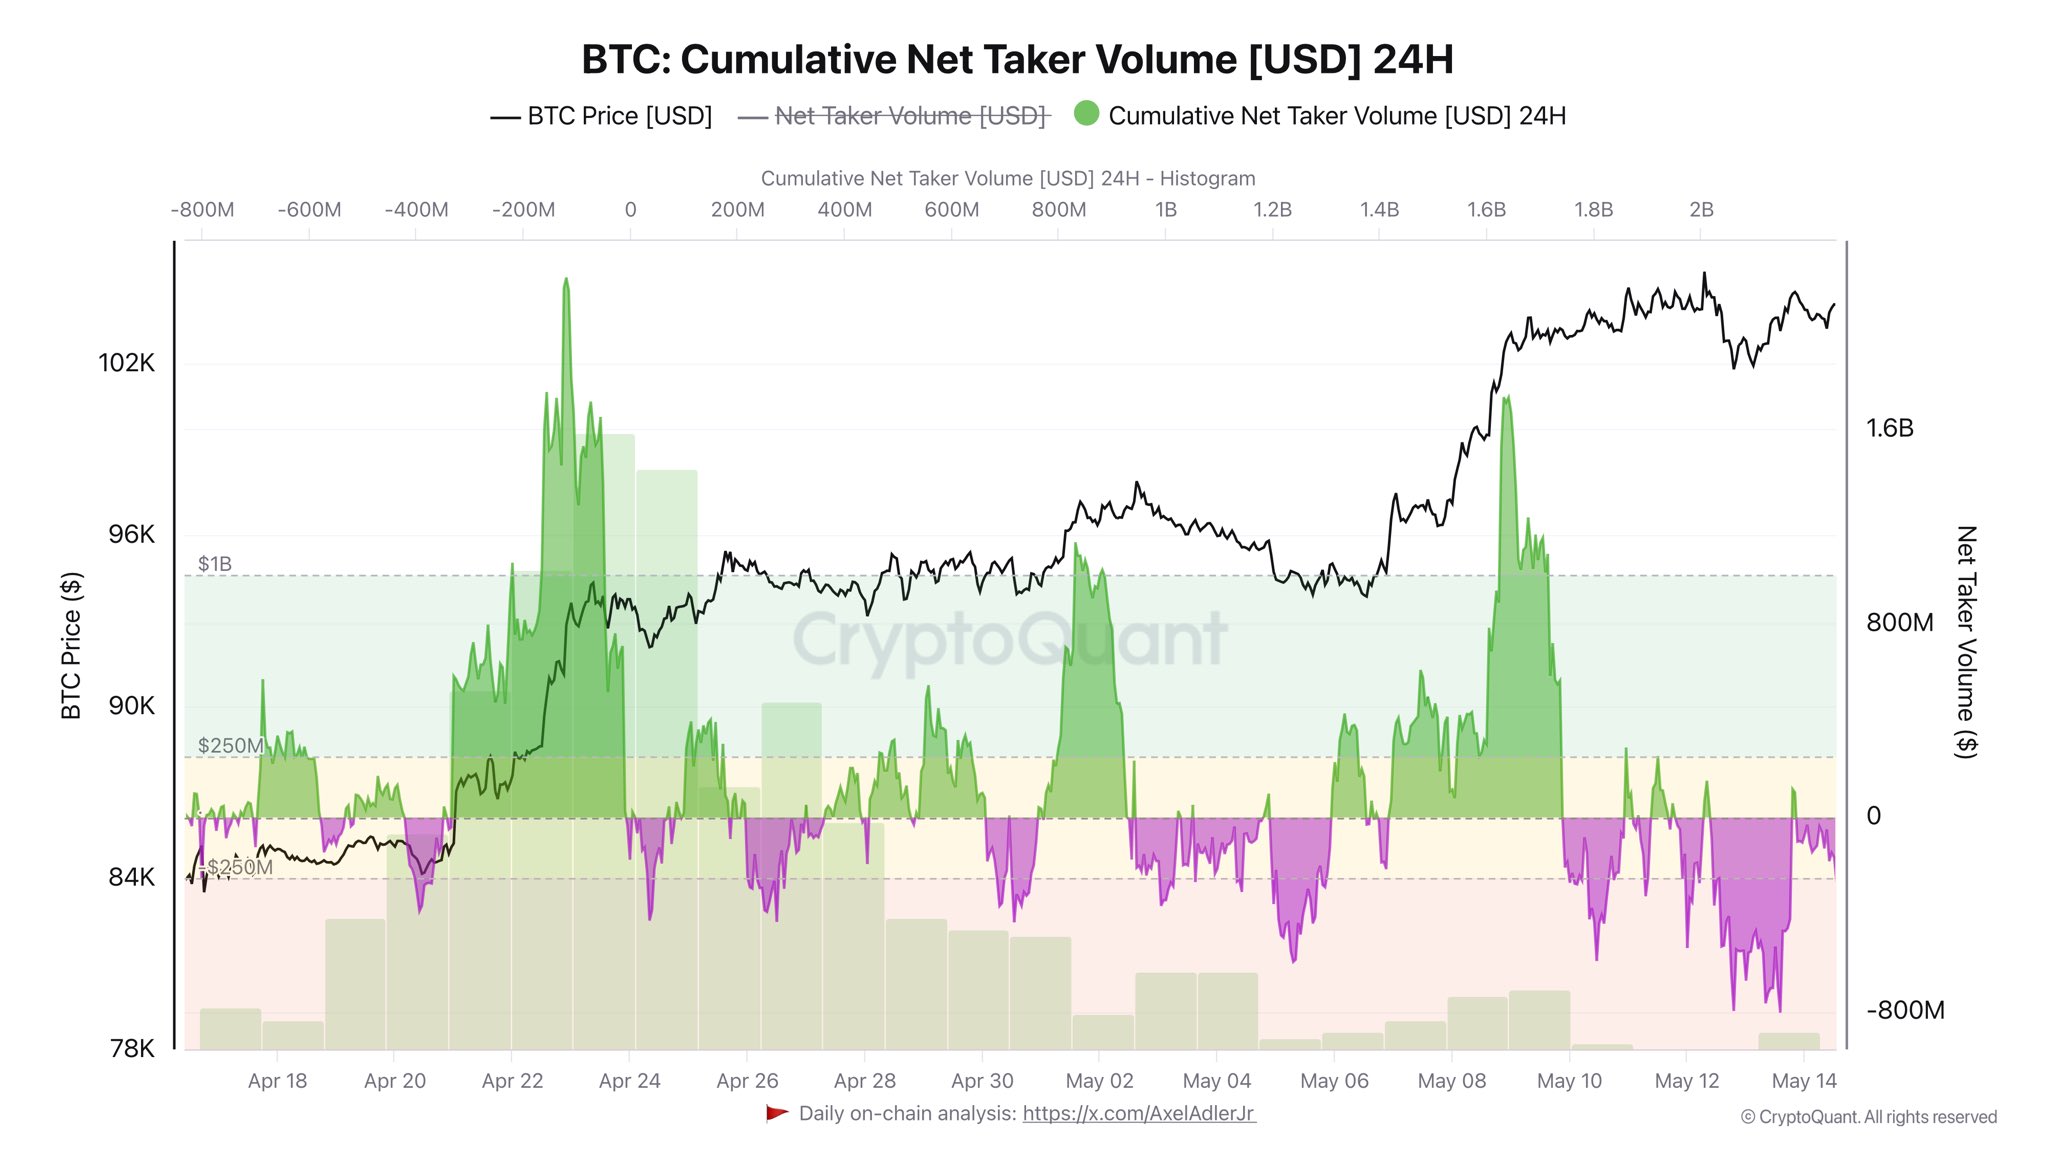
According to his post on X, the root of the slowdown appears to stem from the derivatives market. Specifically, he pointed to the cumulative net taker volume, a metric that tracks the net volume of market orders, remaining in negative territory since BTC crossed above the psychological $100,000 threshold.
This suggests that there are more aggressive sell orders (shorts) than buy orders (longs), creating persistent downward pressure on price. Net taker volume is a useful gauge of real-time trader sentiment, and when it trends negative, it typically signals that market participants expect prices to drop, prompting more short-selling.
The main reason why BTC is currently stuck at these levels comes from the derivatives market.
The cumulative net taker volume has mostly remained in negative territory ever since BTC climbed back above the psychological $100 000 level.
– What does this mean ?
⁰In simple… pic.twitter.com/2ABZ3qzQ0s— Darkfost (@Darkfost_Coc) May 16, 2025
Darkfost emphasized that this trend reflects increasing uncertainty among traders about Bitcoin’s short-term ability to reach new all-time highs. While long-term sentiment remains positive, the imbalance in derivatives activity highlights a cautious approach among participants.
“It clearly reflects a growing sense of doubt among traders regarding Bitcoin’s ability to reach a new all-time high in the very short term,” he stated. “In such a context, the market loves to prove them wrong.” This sentiment-driven hesitation has slowed the pace of Bitcoin’s rally, even as it remains within striking distance of its January high.
Bitcoin Technical Setup Hints at Bullish Continuation
Meanwhile, technical analyst Javon Marks pointed to chart patterns suggesting a potential continuation of Bitcoin’s bullish trend. He highlighted the formation of a bull flag, a technical pattern often interpreted as a pause before the continuation of an upward movement. “Bitcoin looks to be bull flagging right under all-time highs. A breakout can send it above,” Marks wrote.
If confirmed, this could signal renewed upward pressure and open the door for another leg higher. Additionally, Marks noted that altcoins are exhibiting similar behavior to previous market cycles, particularly the surges seen in 2017 and 2021. He suggested that the current phase may precede a broader altcoin rally, which historically tends to follow Bitcoin’s moves.
Altcoins look to be moving similarly and right on track as it did in the 2017 and 2021 surges.
The next phase looks to be where #Altcoins deliver the green light, or in other words push in their most bullish phases.
This can SEND ALTS MUCH HIGHER, FAST
! pic.twitter.com/2wrr0WOTzB
— JAVON
MARKS (@JavonTM1) May 16, 2025
Featured image created with DALL-E, Chart from TradingView