6 signs predicting $140K as Bitcoin's next price top

Key takeaways:
-
Bitcoin’s price is retracing, but strong ETF inflows, high network activity, and whale accumulation suggest BTC is on track to $140,000.
-
Spot Bitcoin ETFs saw $2.9 billion in net inflows in two weeks, mirroring past rallies.
-
Declining exchange balances and a rising transaction volume Z-Score suggest increasing overall demand.
Bitcoin (BTC) price is down 1.4% over the last 24 hours. It trades 6% below its all-time high of $109,000, reached on Jan. 20. Nevertheless, several fundamental, onchain and technical metrics suggest that Bitcoin’s upside is not over.
Spot Bitcoin ETF inflows mirror past BTC rallies
Bitcoin’s latest recovery was accompanied by high investor appetite for spot Bitcoin exchange-traded funds (ETFs), which recorded $2.9 billion in net inflows over the last two weeks.
The chart below shows that after the launch of the US-based spot Bitcoin ETFs in January 2024, these investment products saw net inflows of approximately $8.5 billion between Feb. 13, 2024, and March 13, 2024, peaking at a record single-day inflow of $1.045 billion on March 12, 2024.

Similarly, between Nov. 6, 2024, and Dec. 16, 2024, cumulative daily inflows hit $5.7 billion, aligning with Bitcoin’s 60% rally from $67,000 to $108,000 over the same period.
If ETF inflows continue, Bitcoin is likely to resume its uptrend toward new all-time highs.
Bitcoin market volatility index: risk-on
Increased inflows into spot Bitcoin ETFs signal high risk-on sentiment, as evidenced by a drop in the CBOE Volatility Index (VIX), which measures 30-day market volatility expectations.
Bitcoin network economist Timothy Peterson highlighted that the VIX index has dropped substantially from 55 to 18 over the past 25 trading days.
A VIX score below 18 implied a “risk-on” environment, favoring assets like Bitcoin.
The analyst said:
“This will be a ‘risk on’ environment for the foreseeable future.”

Peterson’s model, which has a 95% tracking accuracy, predicted a $135,000 target within the next 100 days if the VIX remains low.
Strong Bitcoin accumulation continues
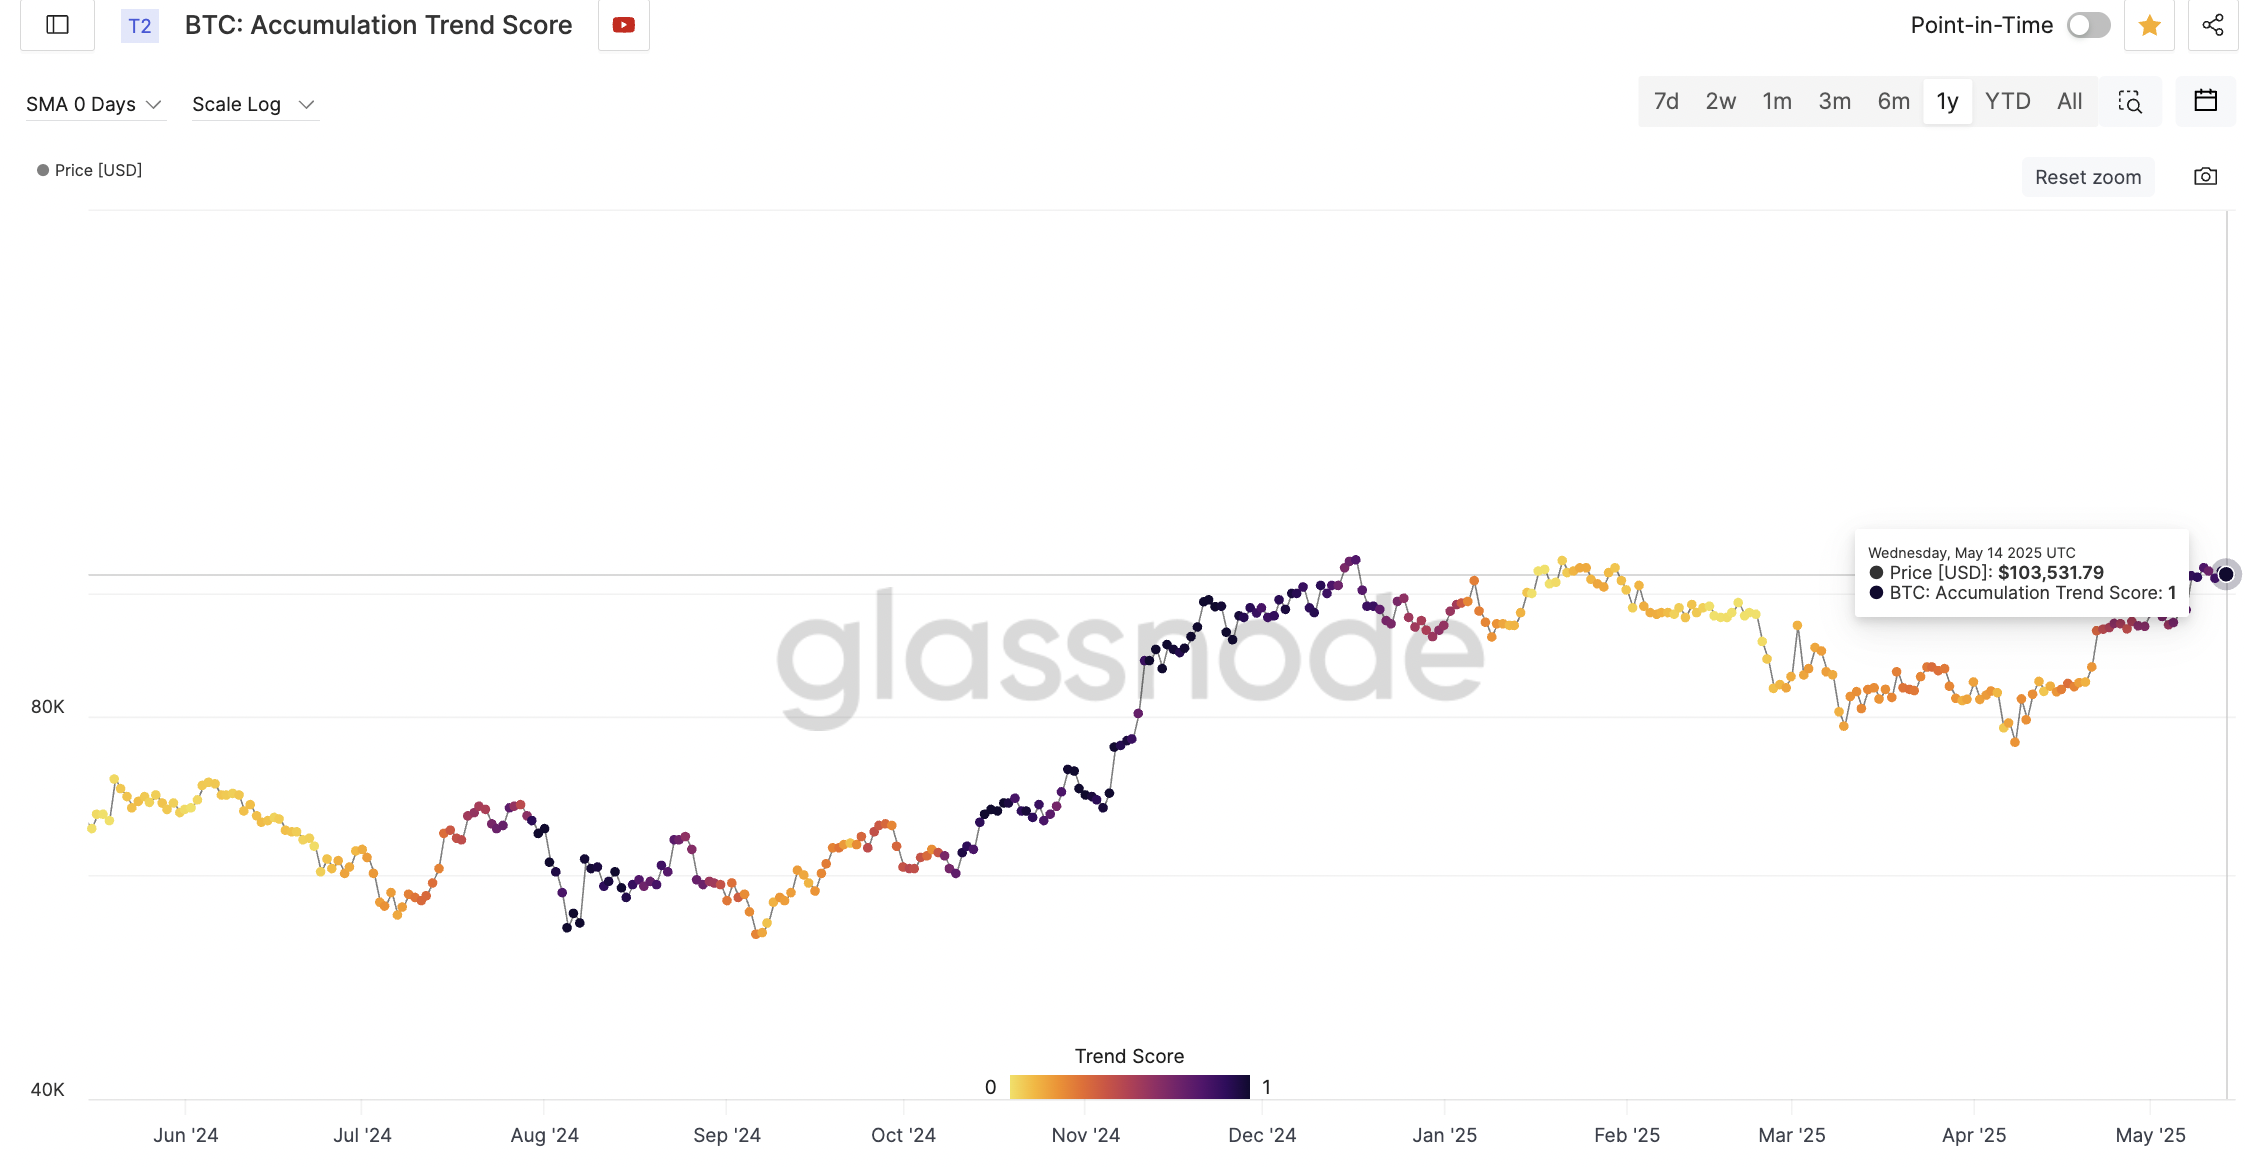
Reinforcing the risk-on sentiment are Bitcoin whales, who have been increasing their holdings even as the price rallied. Glassnode data shows the Bitcoin Accumulation Trend Score (ATS) at 1 (see chart below), which signifies intense accumulation by large investors
According to Glassnode, the spike in trend score indicates a transition from distribution to accumulation across almost all cohorts. This shift mirrors a similar accumulation pattern observed in October 2024, which preceded Bitcoin’s rise from $67,000 to $108,000, spurred by US President Donald Trump’s election victory.
Additional data from Santiment reveals that addresses holding between 10 BTC and 10,000 BTC have accumulated 83,105 more BTC in the past 30 days.
In a May 13 post on the X social platform, Santiment said,
“With the aggressive accumulation from these large wallets, it may be a matter of time until Bitcoin’s coveted $110K all-time high level is breached, particularly after the U.S. and China tariff pause.”
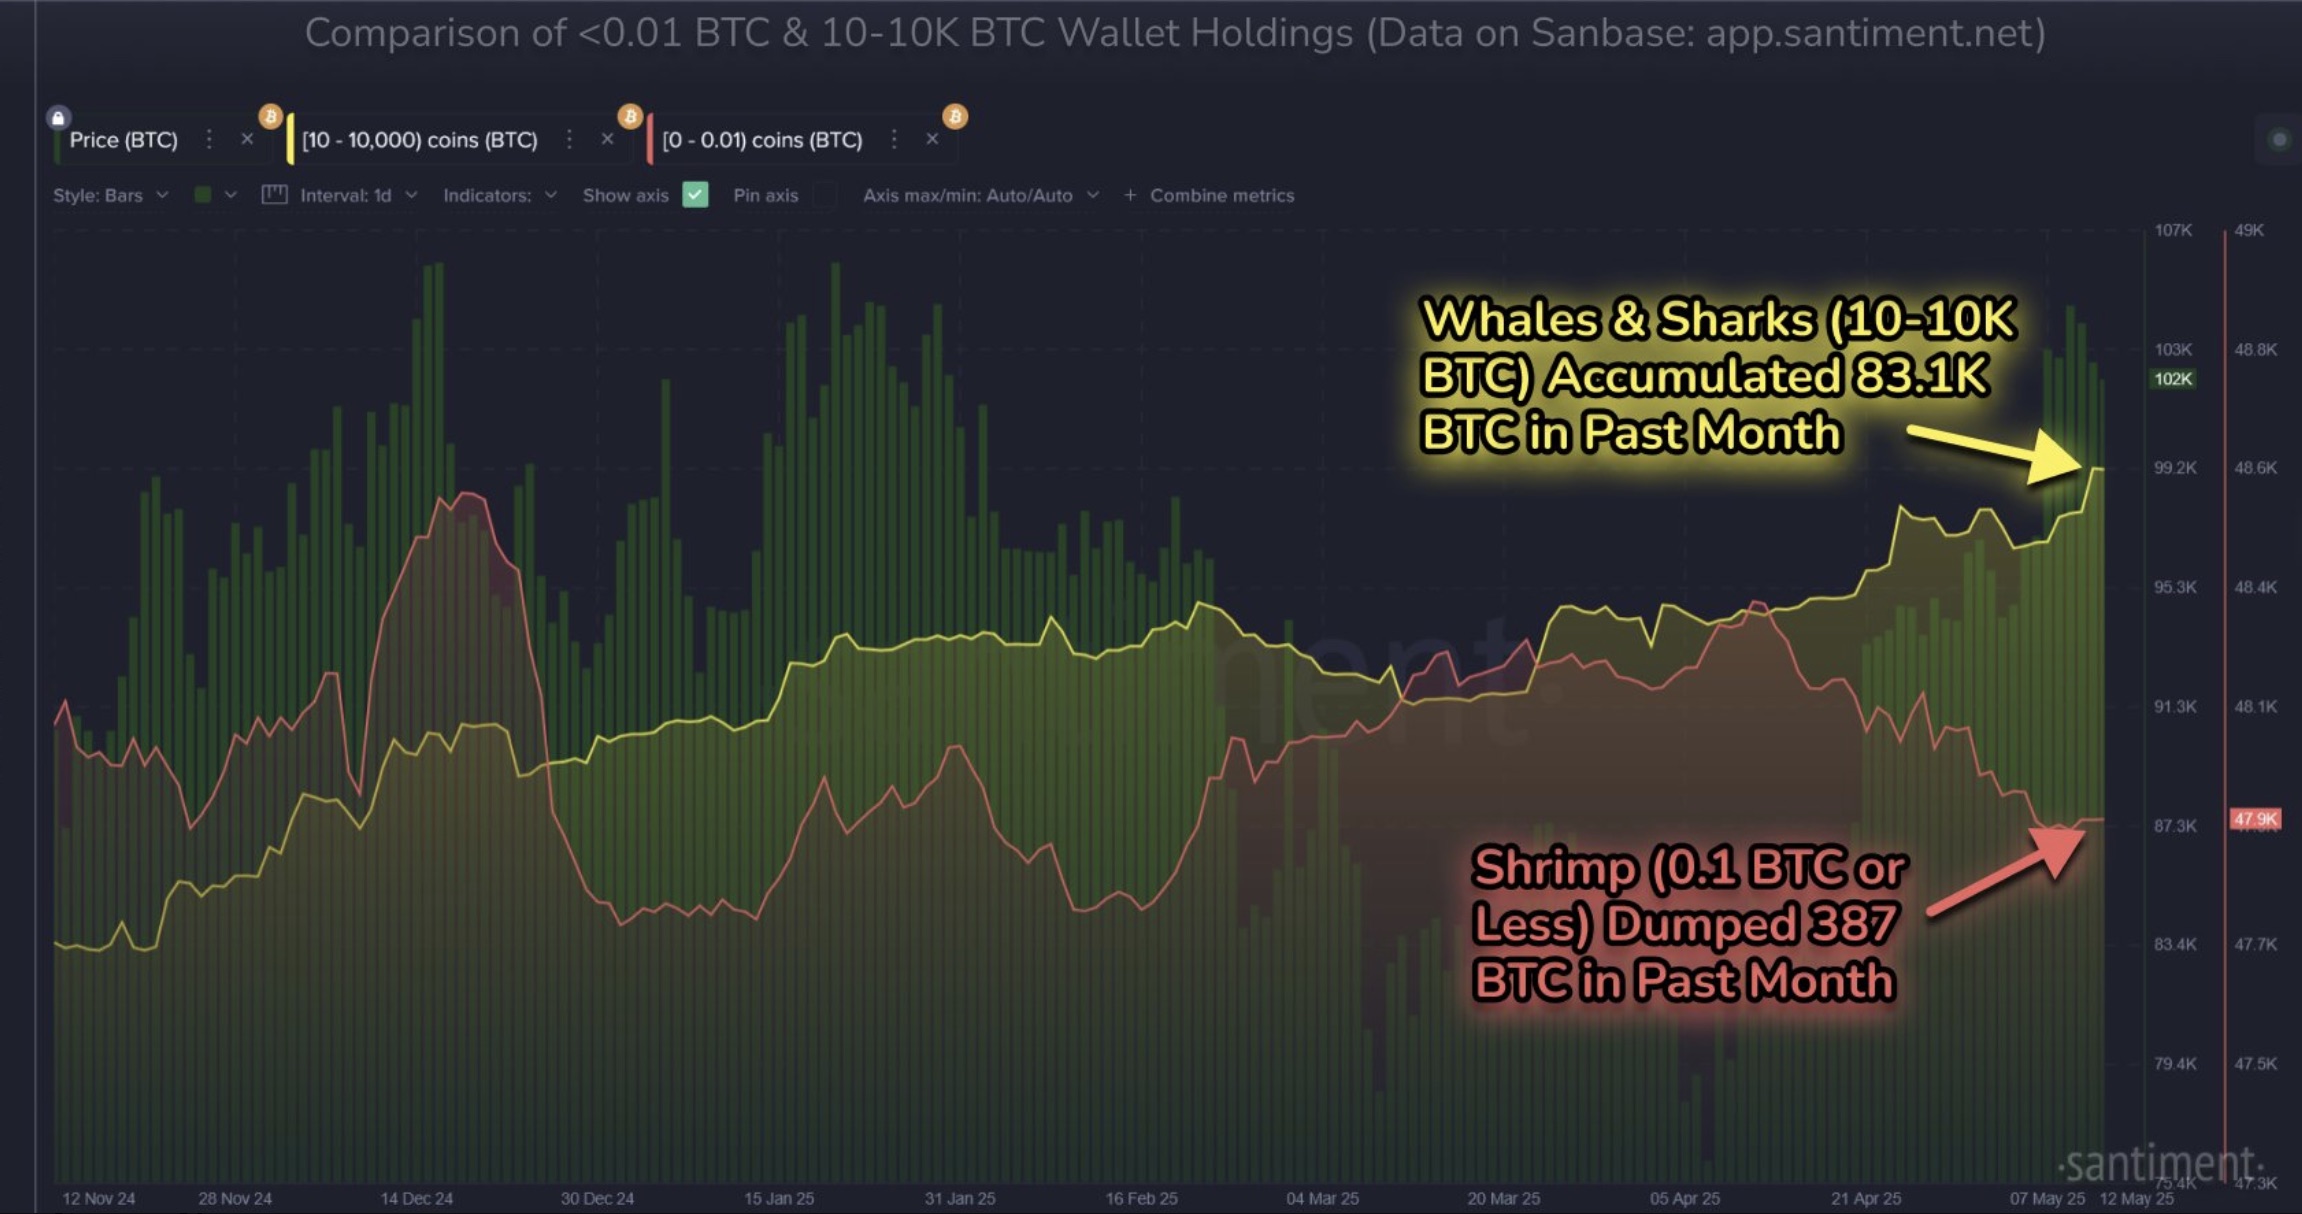
Overall, this is a positive sign as continued accumulation signals bullish sentiment among this cohort of investors.
Related: Bitcoin looks ‘ridiculous’ as bulls attempt $2T market cap flip — Analyst
Declining Bitcoin balance on exchanges
BTC balance on exchanges reached a six-year low of 2.44 million BTC on May 15. According to the chart below, more than 110,000 BTC have been moved off exchanges over the last 30 days.
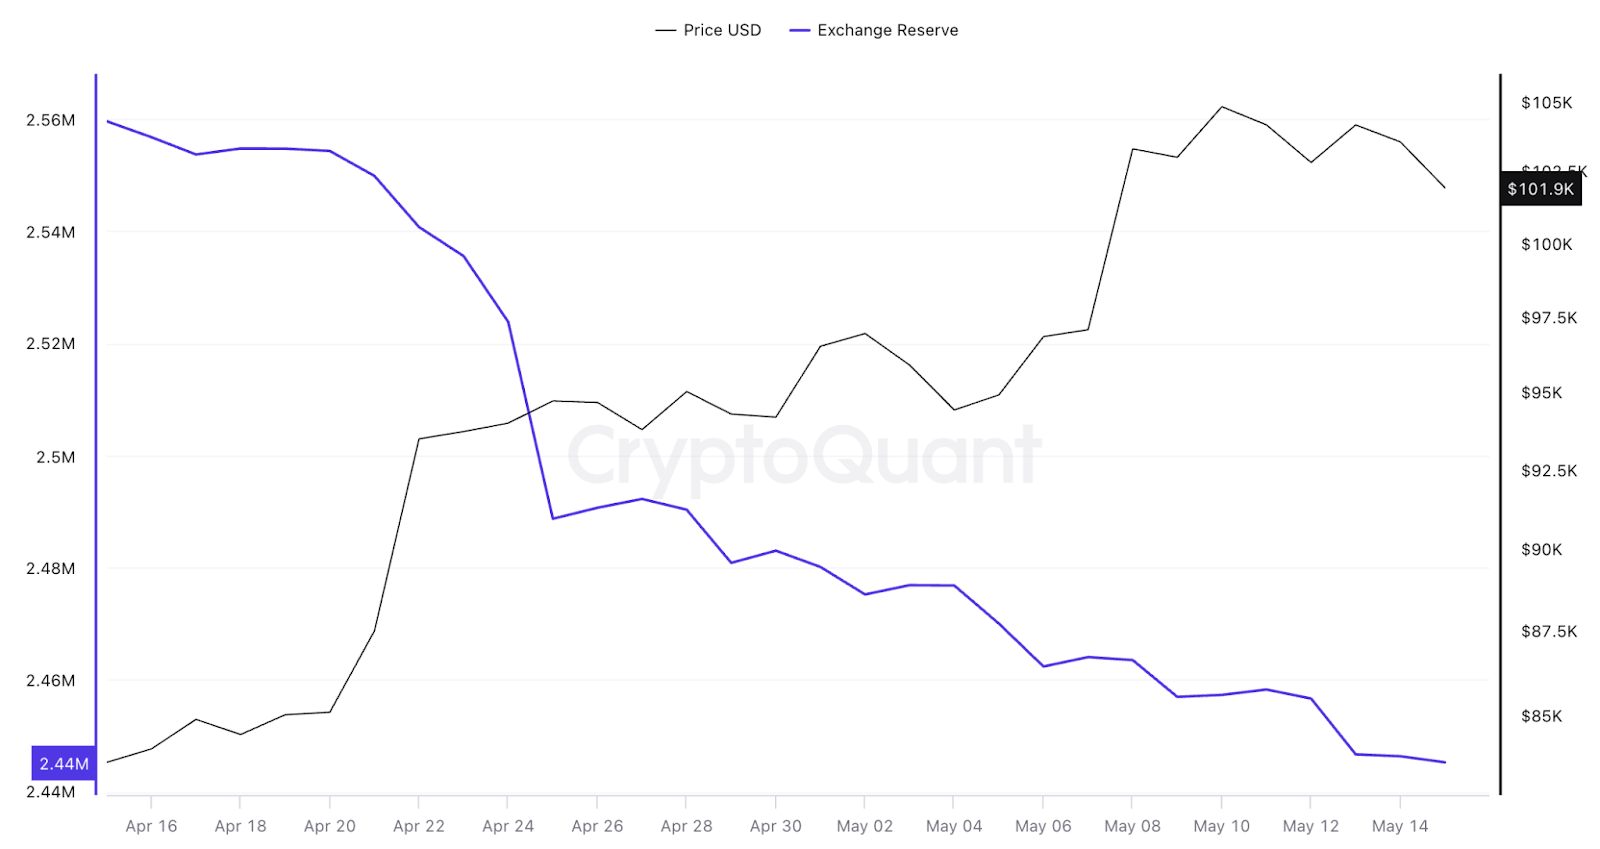
Decreasing BTC balances on exchanges simply means investors could be withdrawing their tokens into self-custody wallets, indicating a lack of intention to sell in anticipation of a future price increase.
Increasing network activity
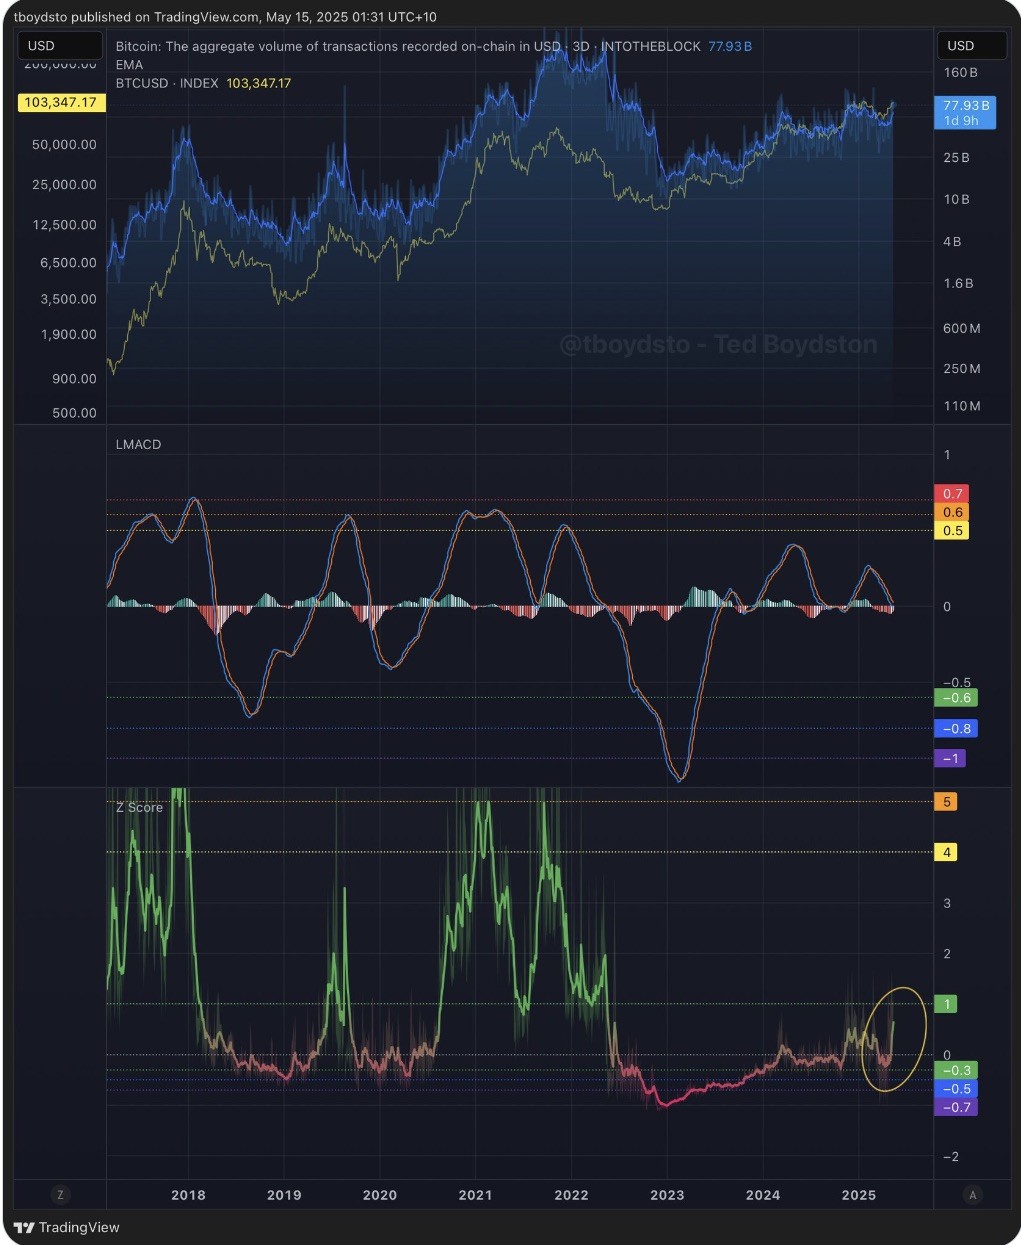
Bitcoin’s potential to rise higher is supported by high network activity, as highlighted by crypto investor Ted Boydston in a May 15 post on X.
The Bitcoin transaction volume Z-Score measures the difference between the current transaction volume and the average. It is often used to gauge network activity and market interest.
The chart below shows the metric has risen sharply from the negative zone and is approaching 1. A rising transaction volume Z-score, especially when it approaches or exceeds 1, is historically associated with Bitcoin price rallies.
“This is a good sign for Bitcoin price acceleration,” remarked Boydsto, adding:
“Bitcoin should be full bull once the Z-Score breaches 1.”
BTC rounded bottom pattern targets $140K
From a technical perspective, Bitcoin’s price has formed a rounded bottom chart pattern on the daily chart (see below). Bills are now focused on pushing the price above the neckline of the governing chart pattern at $106,660.
A daily candlestick close above this level would confirm a bullish breakout from the rounded bottom formation, ushering BTC into price discovery with the technical target set at $140,000 or a 37% increase from the current level.
A daily candlestick close above this level would confirm a breakout into price discovery, with the technical target set at $140,000 or a 37% increase from the current level.
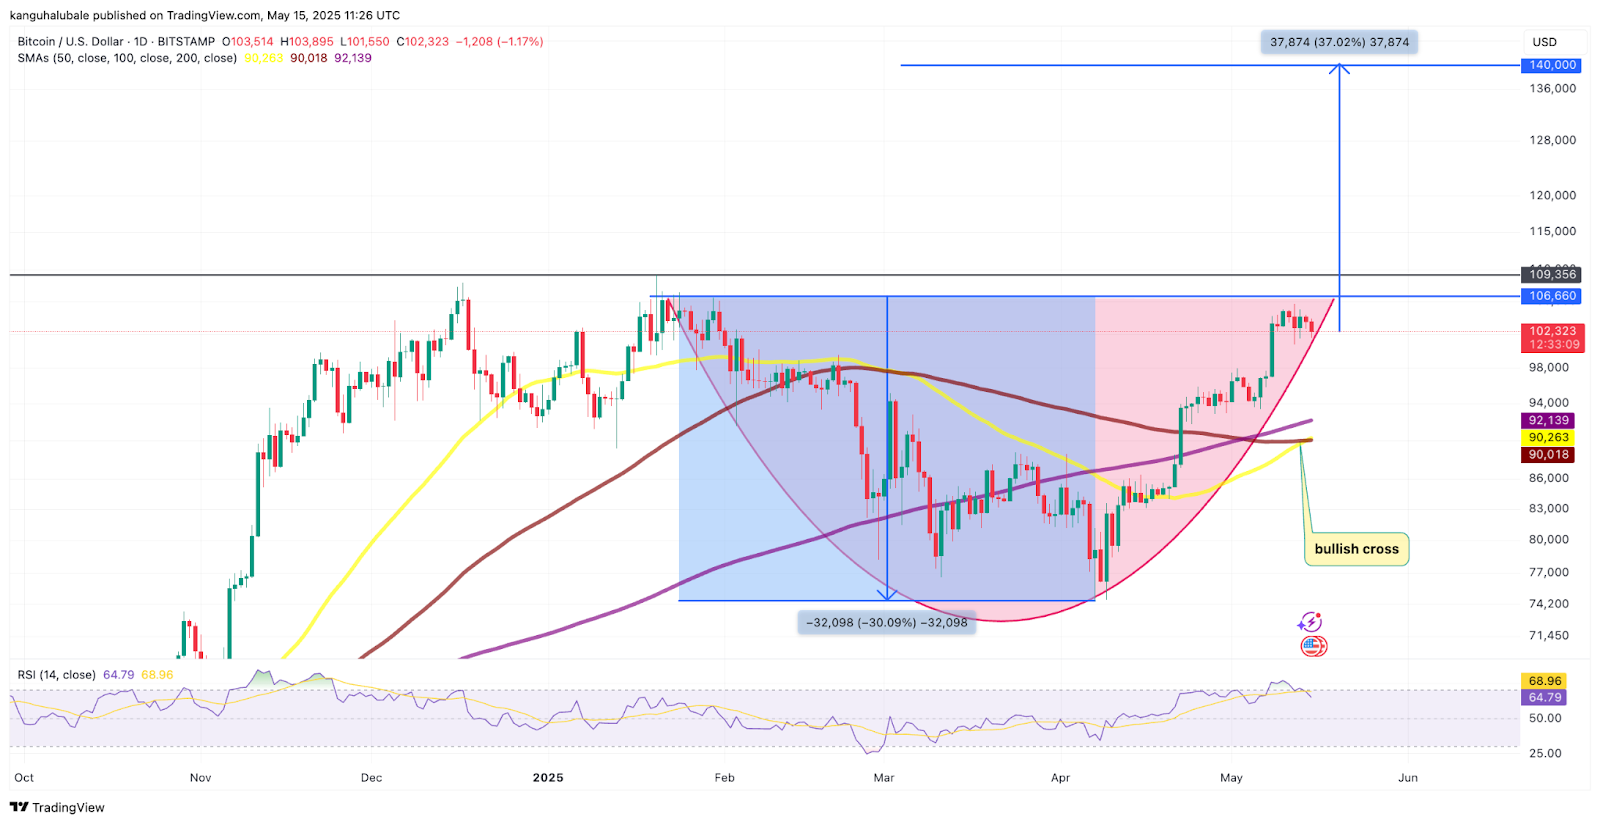
The relative strength index, or RSI, is at 70, and a bullish cross from the SMAs suggests that the market conditions still favor the upside, which can top out at even higher than $140,000.
As Cointelegraph reported, BTC price had broken out of a bull flag in the weekly timeframe, projecting a rally to $150,000.
This article does not contain investment advice or recommendations. Every investment and trading move involves risk, and readers should conduct their own research when making a decision.