Bitcoin profit taking at $106K the first stop before new all-time BTC price highs
Key Takeaways:
-
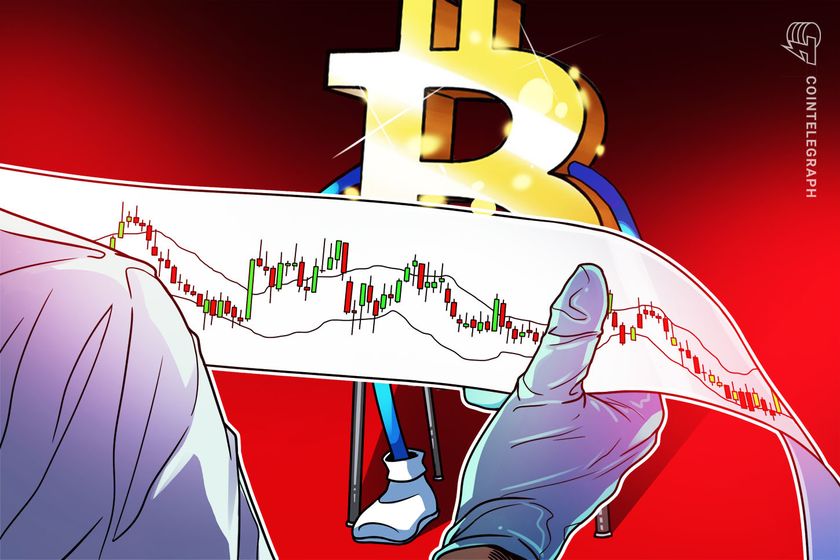
Bitcoin exhibits a bearish breakout from an ascending channel, with the risk of profit-taking near $106,000.
-
A lower-than-expected US Consumer Price Index (CPI) print could boost Bitcoin, but a higher CPI may increase bearish pressure, leading to a price drop below $100,000.
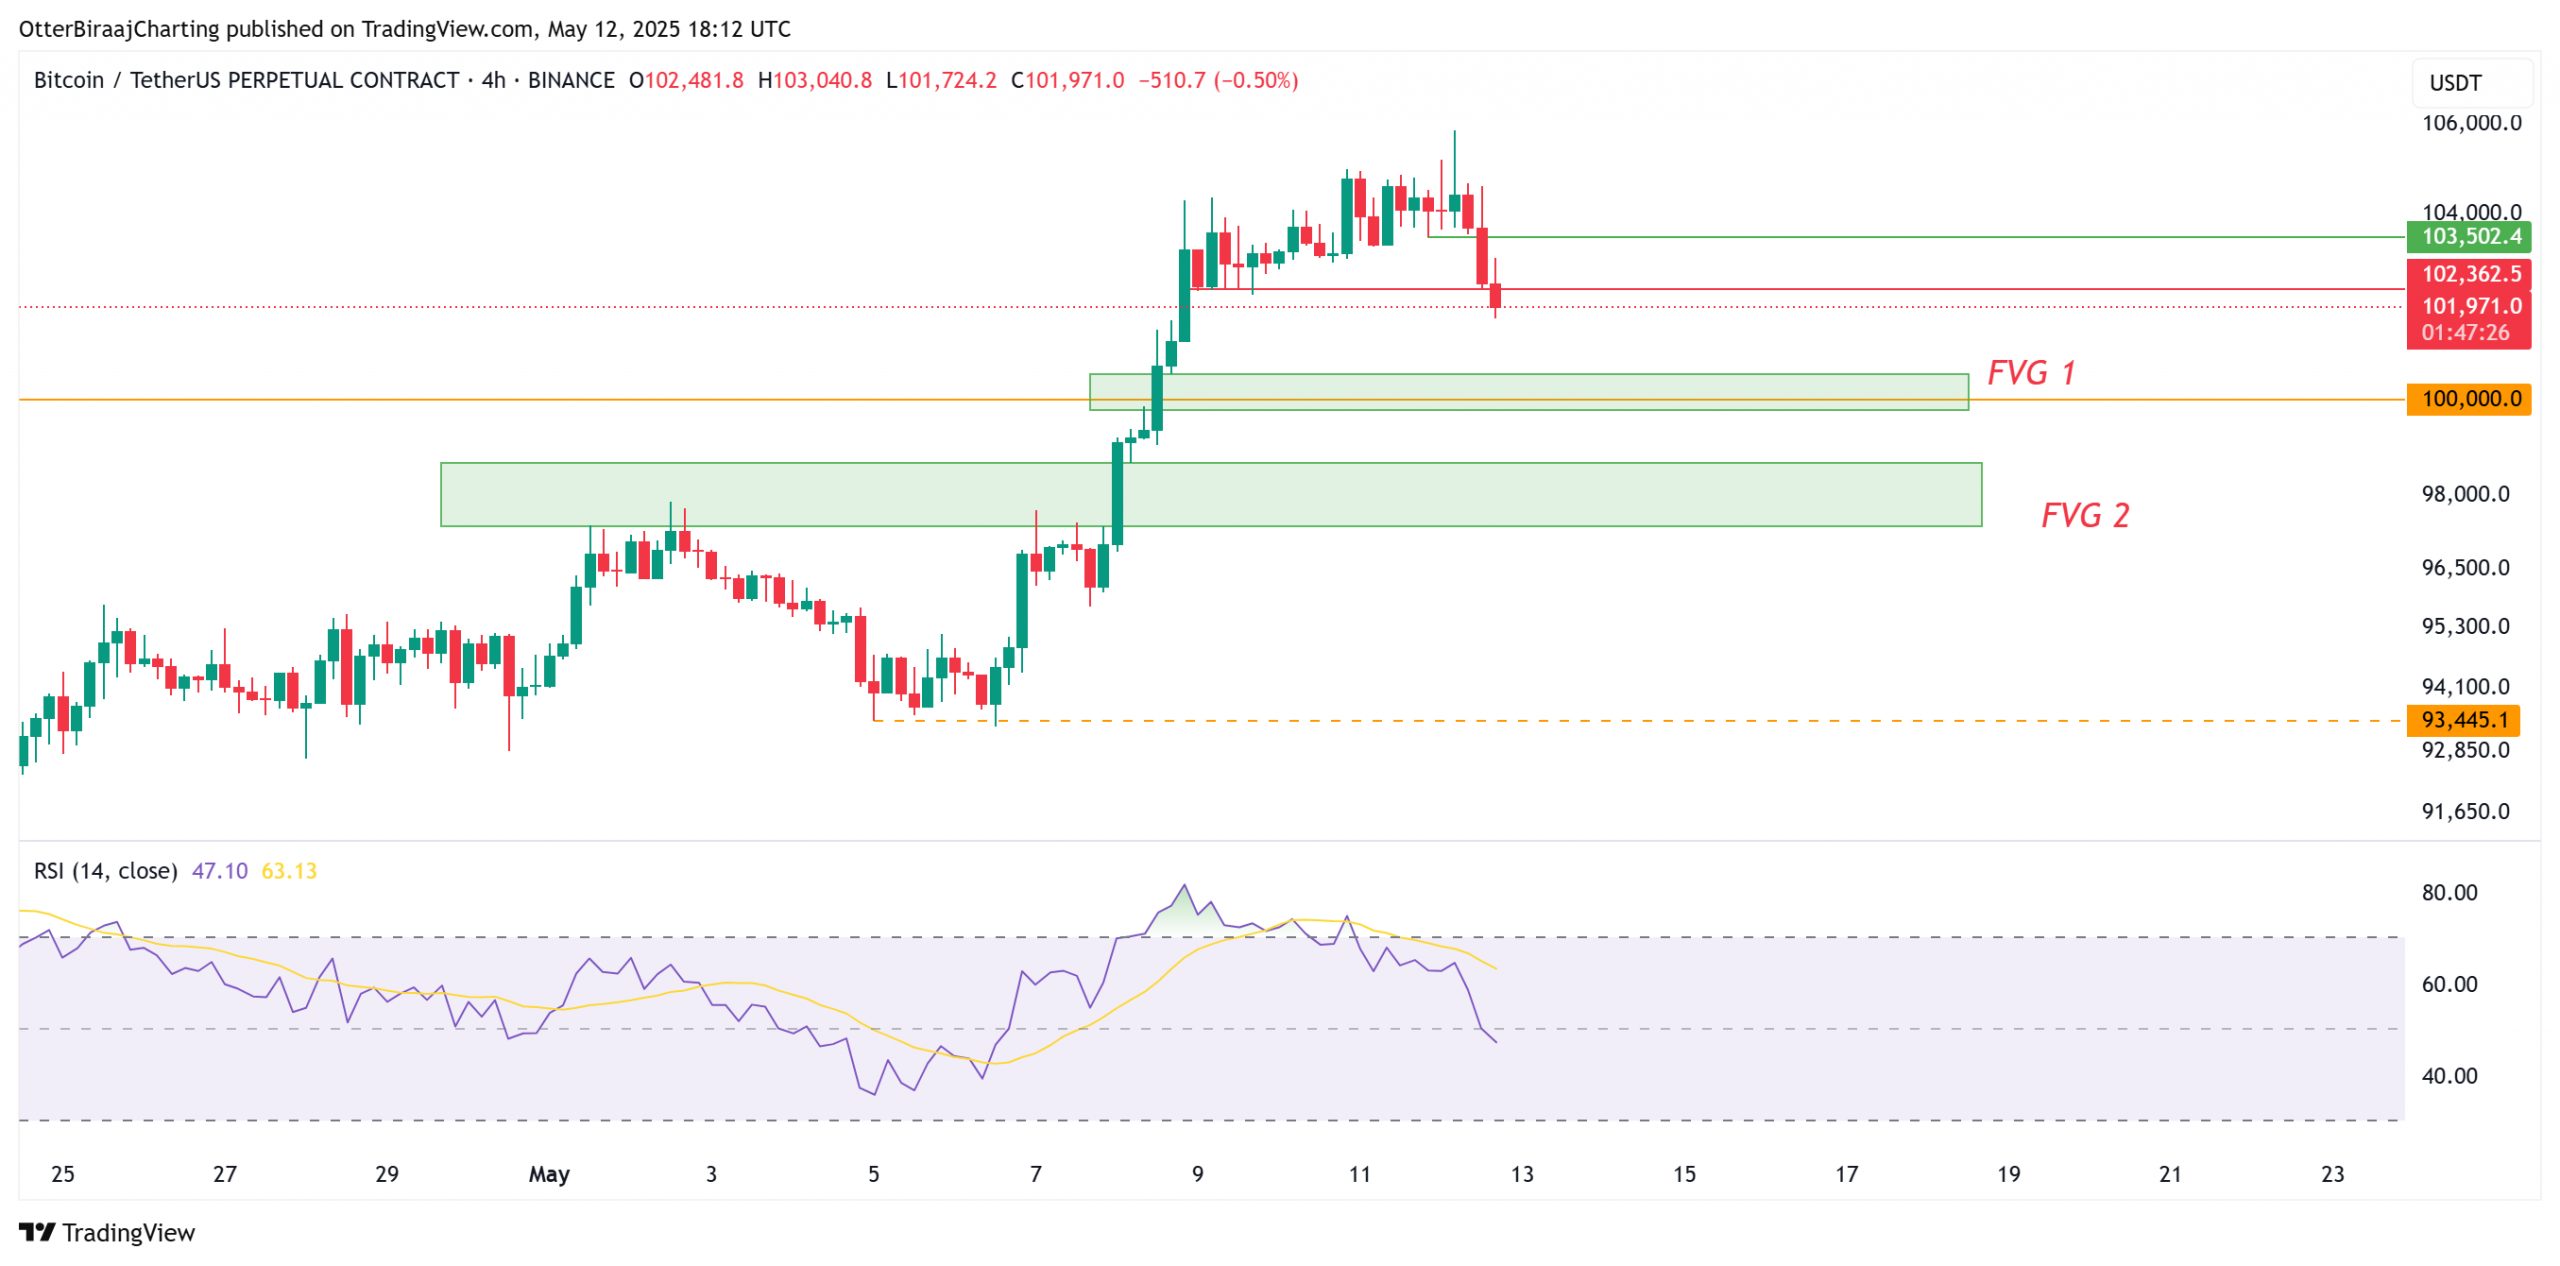
Bitcoin (BTC) price reached an intraday high of $105,800 on May 12 but posted a 3% dip to $101,400 during the New York trading session. On the lower-time frame (LTF) chart, BTC oscillated between an ascending channel pattern before exhibiting a bearish breakout below the bottom range of the pattern.
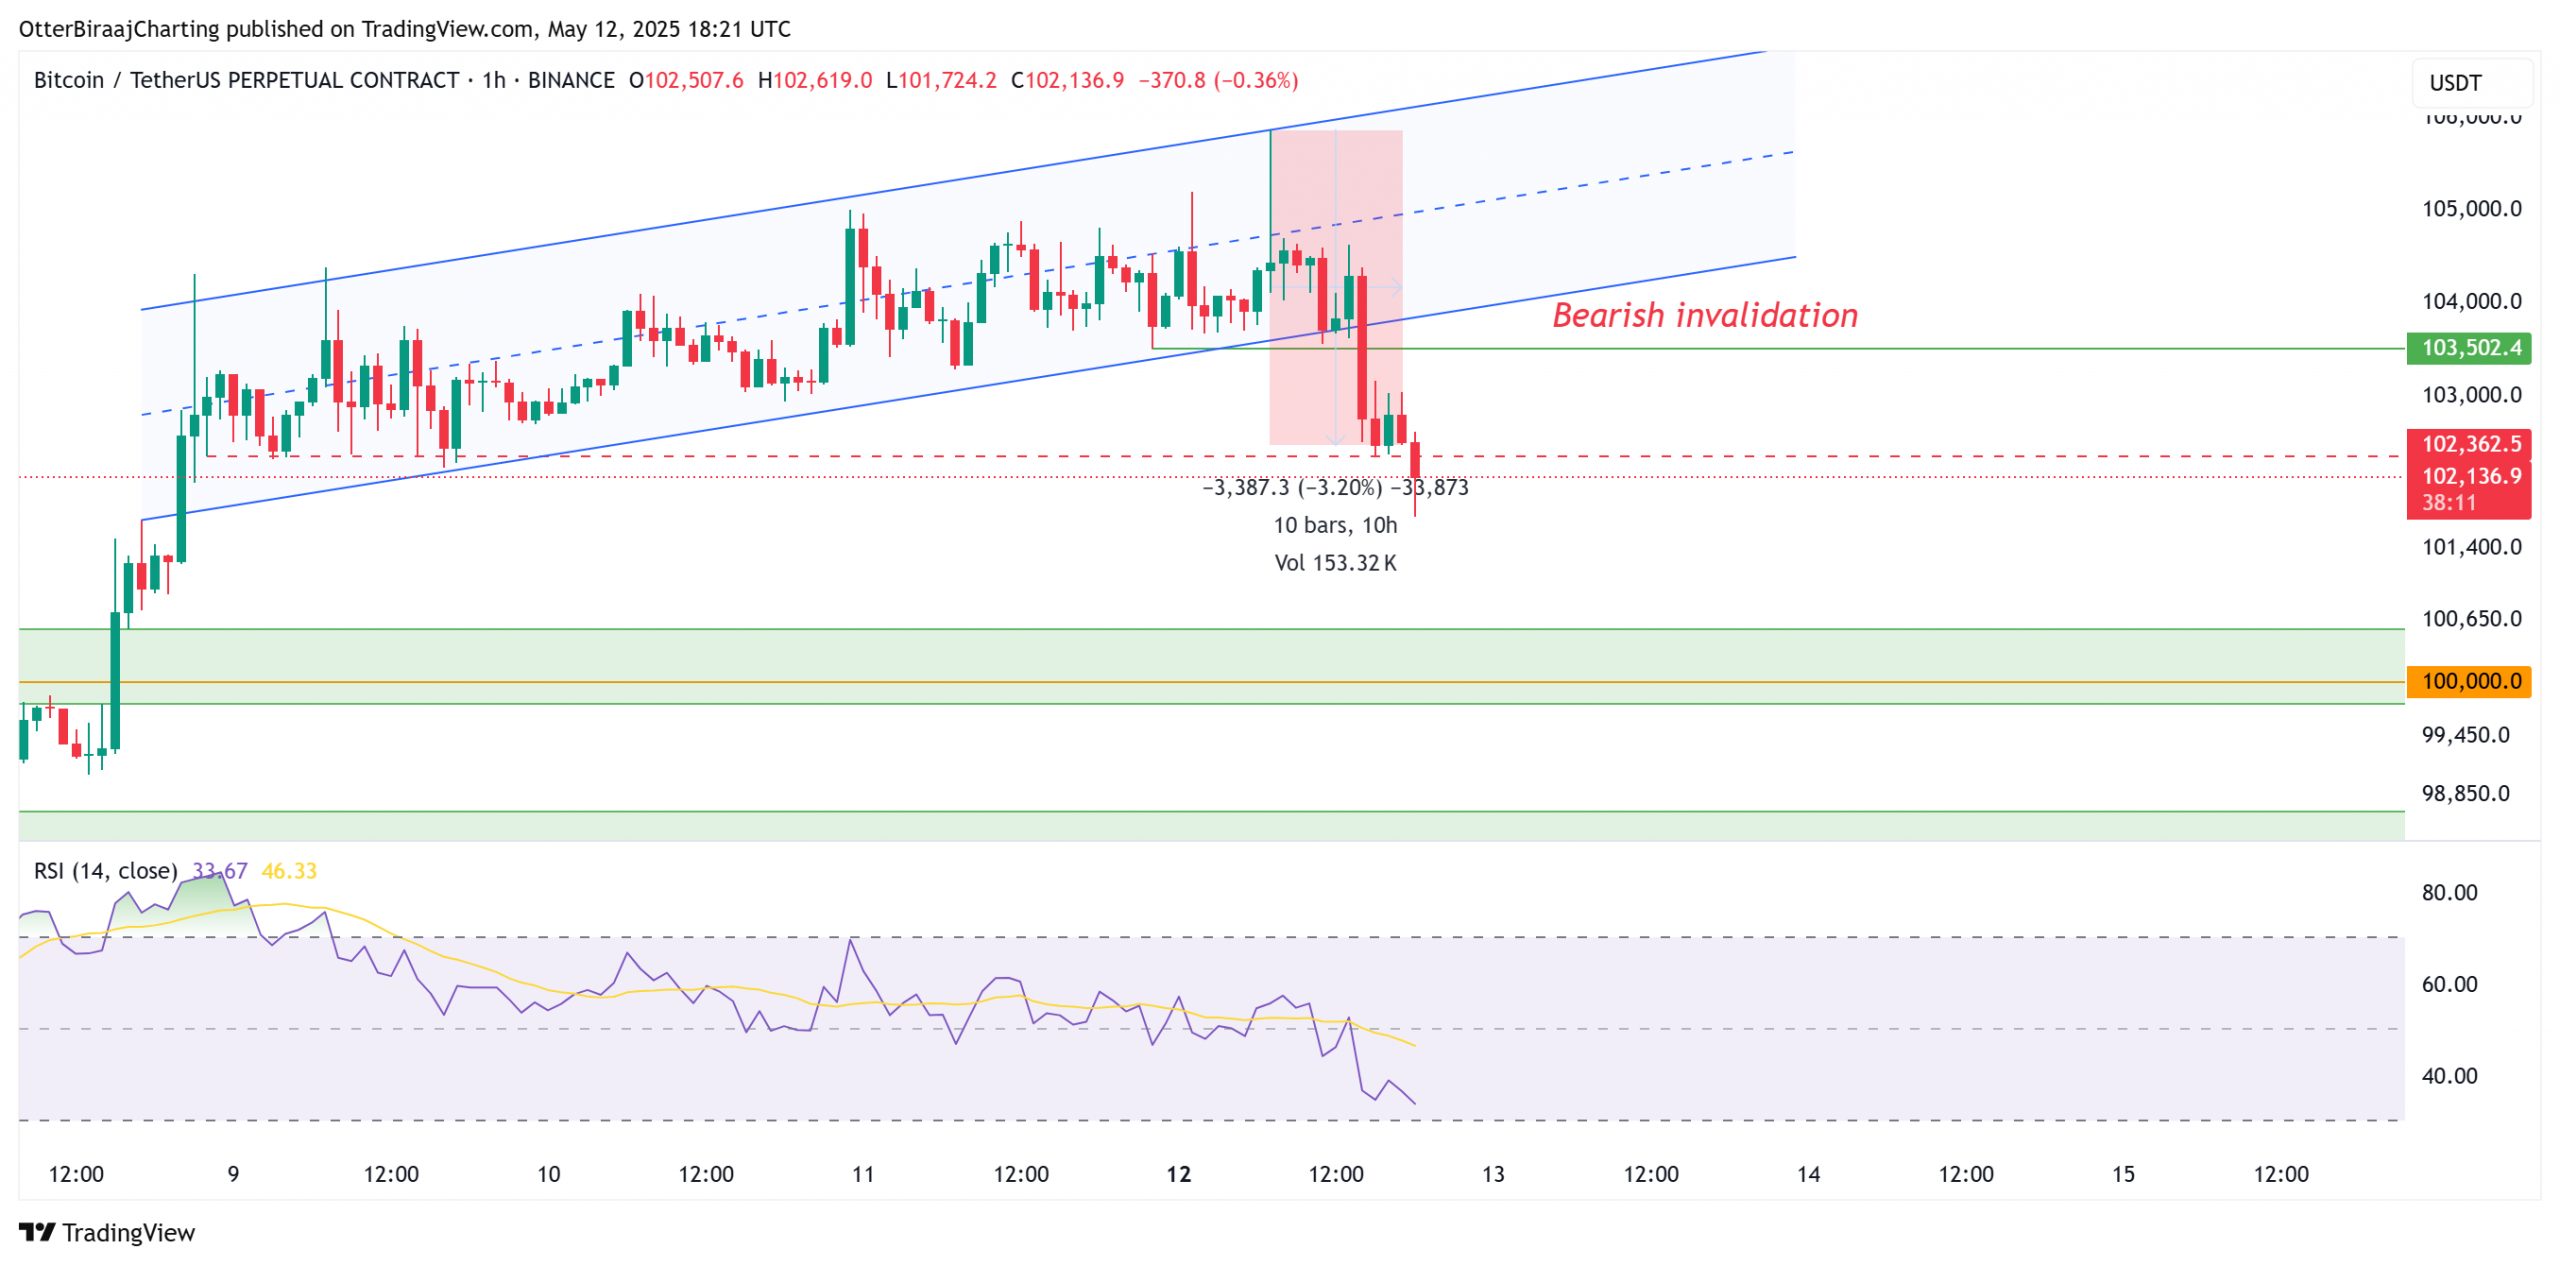
With respect to BTC’s stalling bullish momentum, data analytics platform Alphractal noted that BTC re-testing nearing $106,000 resistance levels increased the likelihood of profit-taking risks. As illustrated in the chart, Bitcoin currently approaches the “Alpha Price” zone, where long-term holders or whales could take profits, according to Joao Wedson, CEO of Alphractal.
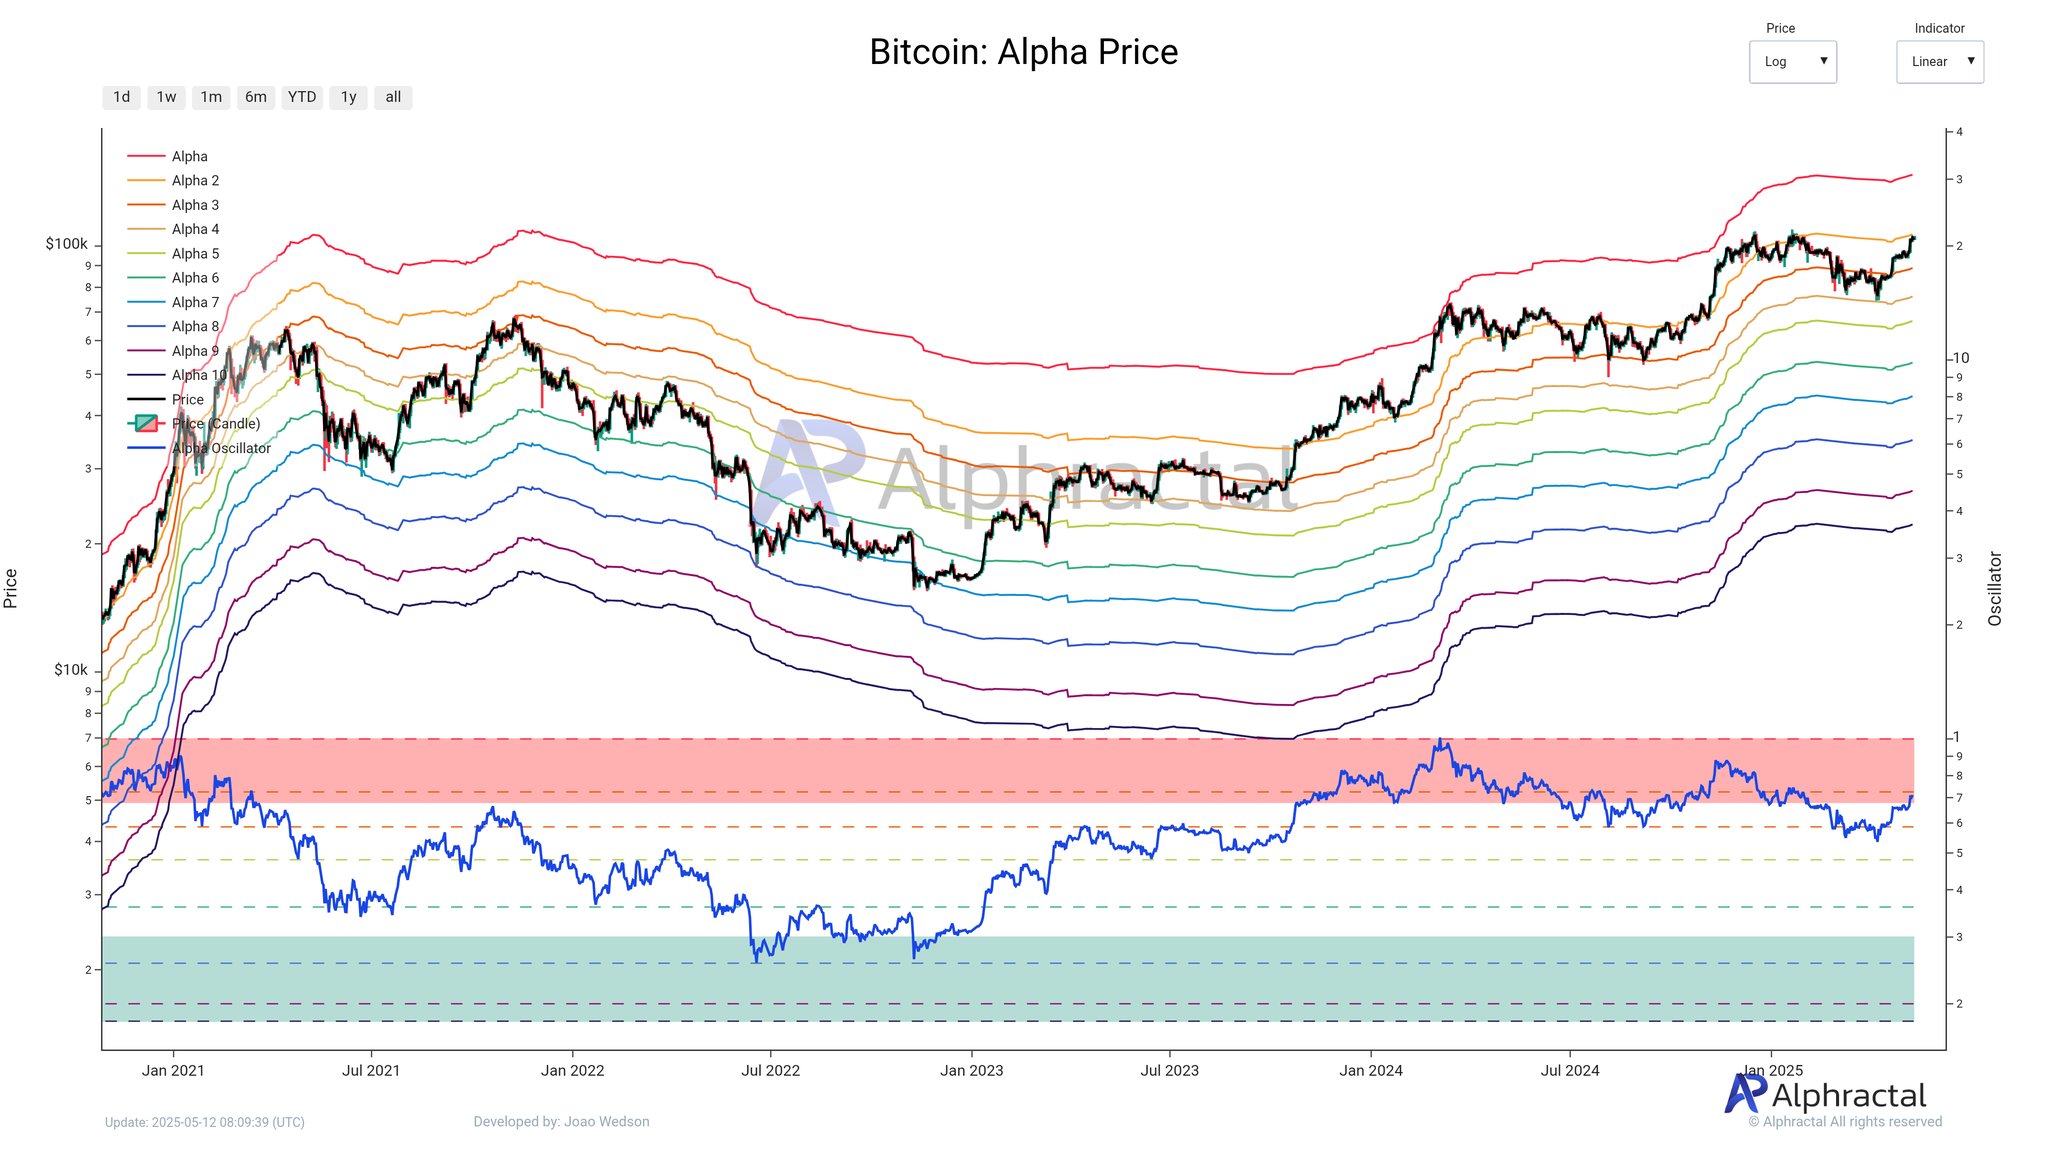
From a liquidation standpoint, the risk of a “long” squeeze is also elevated, with over $3.4 billion in leveraged long positions at risk of liquidation if prices drop to $100,000. This range could act as a magnet for price, leading to a retest near the psychological level.
Related: Bitcoin all-time high cues come as US-China deal sends DXY to 1-month high
CPI data looms as Bitcoin traders de-risk
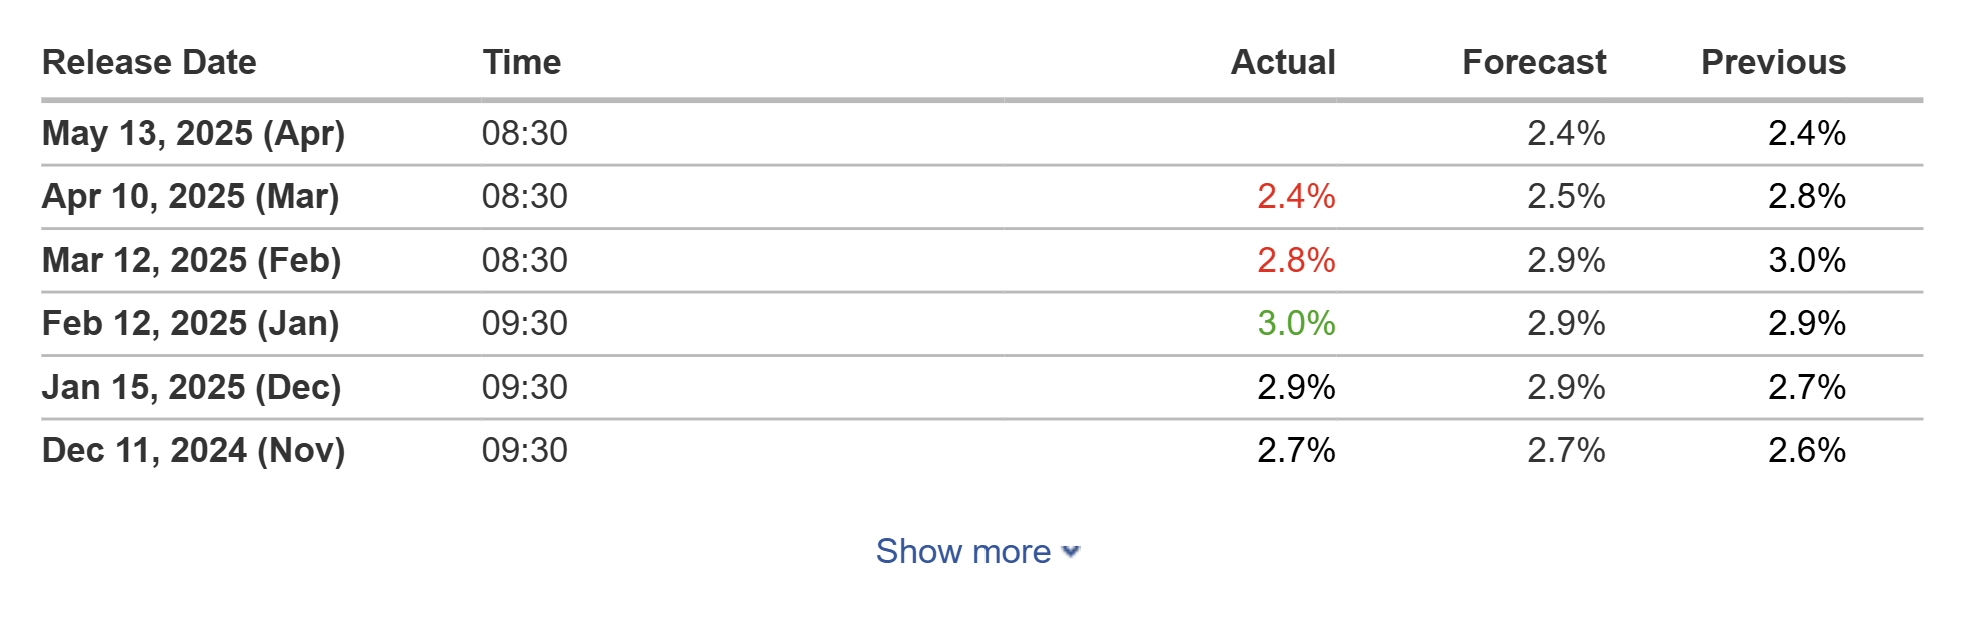
The current BTC correction might reflect traders de-risking ahead of the US Consumer Price Index (CPI) release on May 13. Previously, March’s CPI, released April 10, was 2.4%, down from February’s 2.8%, despite a forecast of 2.5%. April’s CPI is forecasted to remain at 2.4%, due to steady energy prices amid balanced oil production and moderating wage growth, easing pressure on price increases.
A lower-than-expected CPI (potentially third in a row) could be bullish for Bitcoin, potentially signaling Federal Reserve rate cuts in 2025, boosting risk assets like equities and cryptocurrencies. Conversely, a higher-than-expected CPI could be bearish, raising inflation fears and strengthening the dollar, pressuring BTC.
If bearish pressure persists on BTC charts even after the CPI print, an immediate key area of interest remains between $100,500 and $99,700, a fair value gap (FVG) on the four-hour chart.
Another FVG remains between $98,680 and $97,363, which would represent an 8% correction from the recent highs.
Related: Bitcoin, altcoins poised to rally on US-China tariff agreement
This article does not contain investment advice or recommendations. Every investment and trading move involves risk, and readers should conduct their own research when making a decision.