Dogecoin Is ‘All Going To Plan,’ Says Crypto Analyst
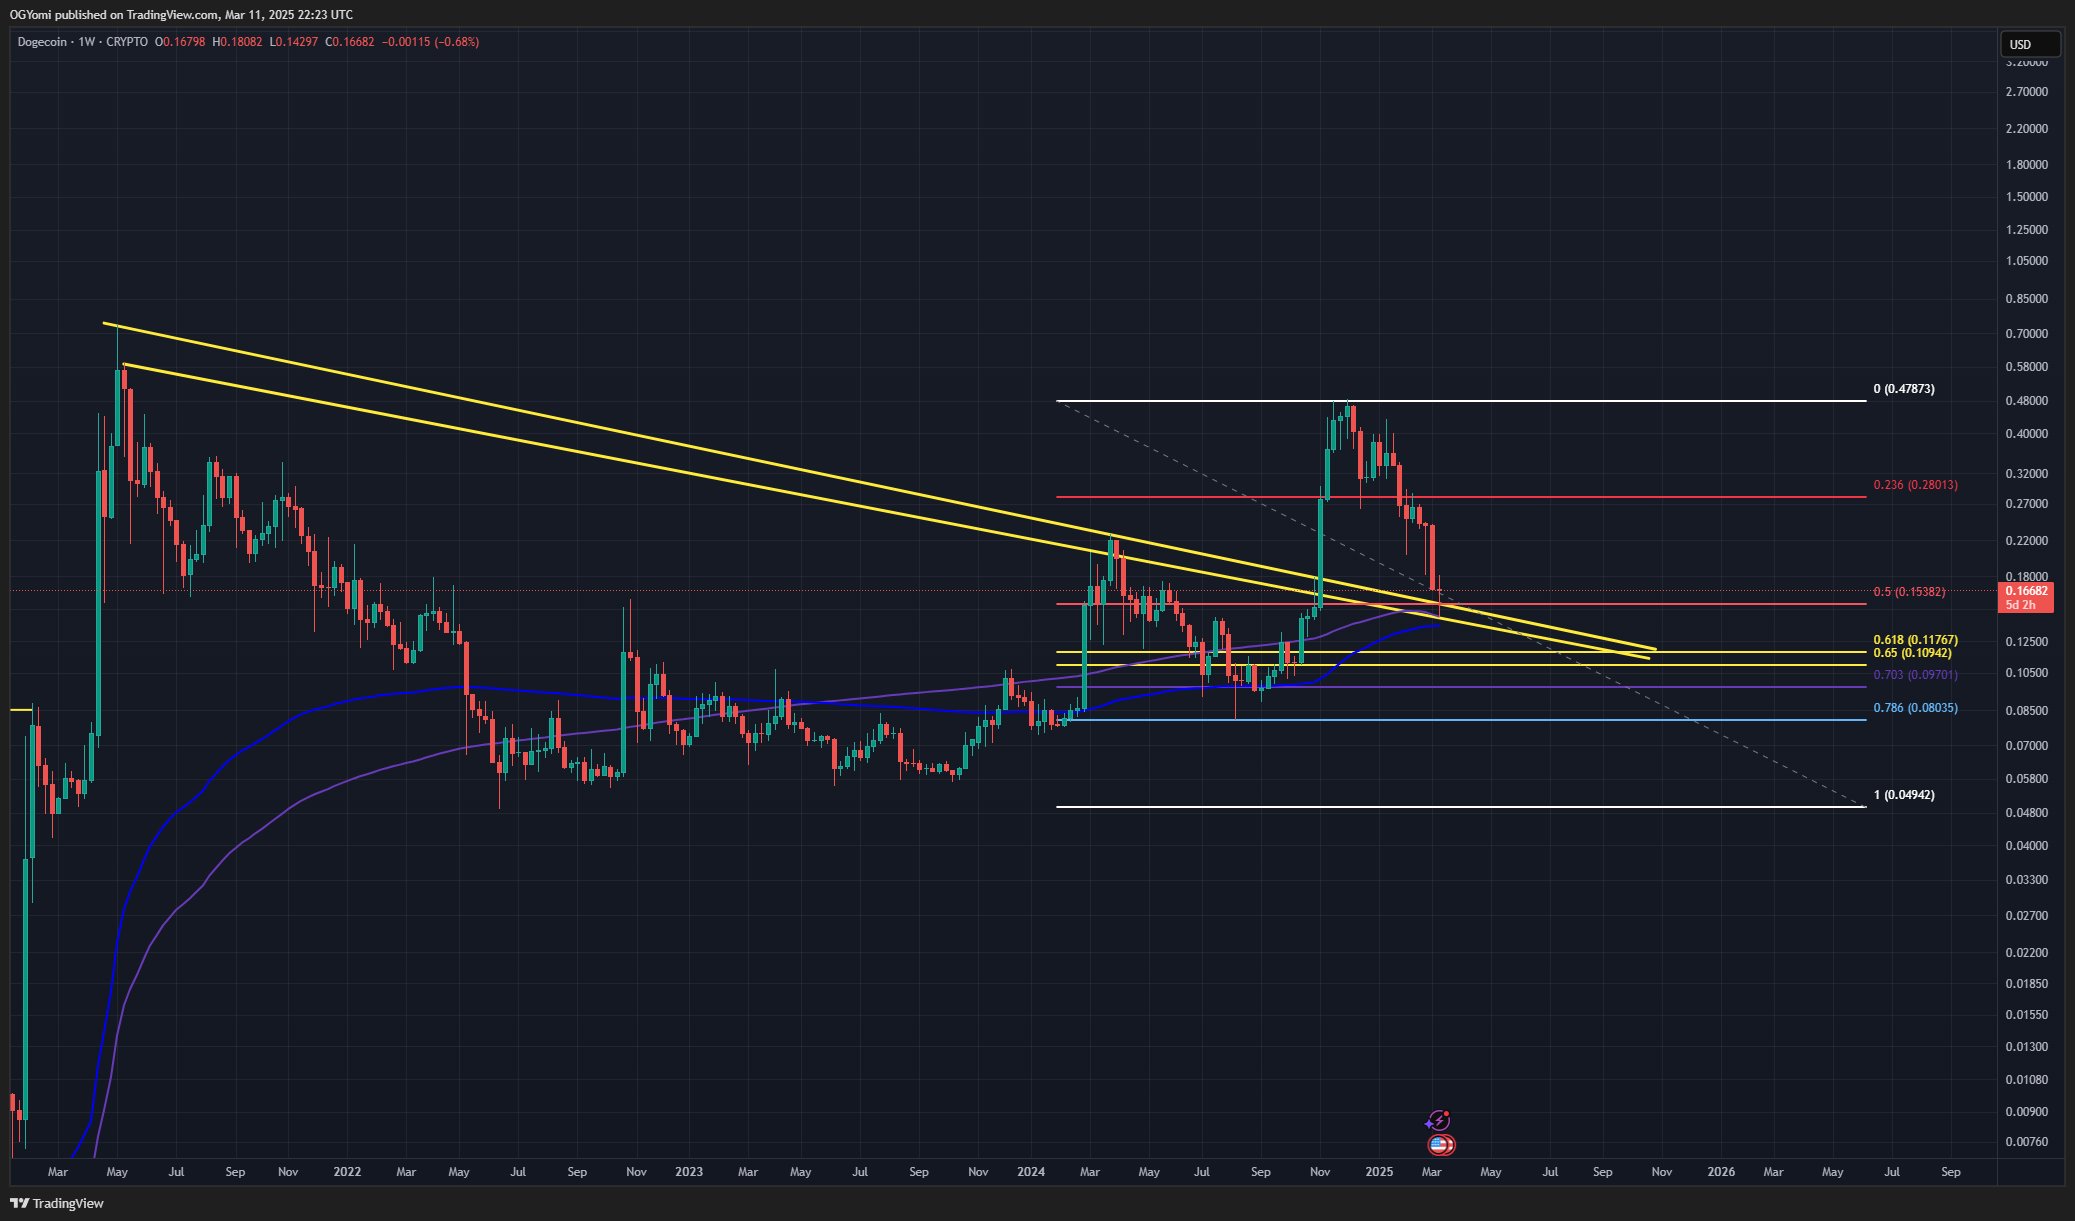
Crypto analyst Kevin has provided an update on Dogecoin’s price structure, highlighting how multiple technical elements have converged to support his thesis that the meme coin remains on track despite recent volatility. The chart, which he first shared two weeks ago, reveals a confluence of Fibonacci retracement levels, descending yellow macro trend lines, and the positioning of the 200-week SMA (Simple Moving Average) and EMA (Exponential Moving Average).
Dogecoin Follows ‘The Plan’
According to Kevin, these converging signals have collectively allowed Dogecoin to perform a critical macro back test, a process that—if successful—can often transition a market from a corrective phase into a new, more bullish phase. “We still got work to do folks but so far it’s all going to plan for Dogecoin,” Kevin wrote today via X.
Central to his view is the 0.5 Fibonacci retracement level around $0.15382, which Dogecoin is currently hovering near. Derived from the coin’s larger swing high, the 0.5 retracement typically denotes a point of equilibrium in a bigger market move.
This level also intersects with the yellow downward-sloping trend lines that have defined the macro resistance for Dogecoin since its earlier bull market peaks. The synergy between this retracement level and the trend line retest is a key reason Kevin believes the pullback remains orderly and “all going to plan.” Farther above, Dogecoin’s next Fibonacci milestone is the 0.236 level near $0.28013 (red horizontal band) that would likely need to be overcome for a more definitive uptrend to develop.
Below current trading ranges, the chart highlights a cluster of potential support levels, including the 0.618 Fibonacci marker around $0.11767 and the 0.65 retracement near $0.10924. Although there is no guarantee Dogecoin’s price will drop to these thresholds, Kevin notes that if further consolidation were to occur, the coin might find stability in that zone.
Additional deeper retracement points include the 0.786 level around $0.08035 and the 1.0 extension down near $0.04942—areas that, in previous cycles, provided meaningful bounces for tokens experiencing prolonged corrections.
Meanwhile, the weekly moving averages in blue on the chart, specifically the 200-week SMA and EMA, offer further context for longer-term sentiment. They are currently running just below Dogecoin’s spot price, forming another layer of support.
Kevin’s analysis also cites momentum data from the 3 Day RSI (Relative Strength Index), indicating that RSI readings have been near historically low levels for Dogecoin. Low RSI readings can sometimes suggest a market is oversold, which in turn raises the prospect of a relief rally or broader turnaround if other bullish catalysts emerge.
He referenced four focal points he first identified in a post two weeks prior: the retest of the macro 0.5 Fibonacci zone, the descending trend line confluence, the back test of the 200-week SMA and EMA, and the notably low RSI values. He further emphasized that Bitcoin’s overall resilience, along with the evolution of macroeconomic data and central bank monetary policy, could shape whether Dogecoin’s price can capitalize on these technical signals.
“If BTC holds up and Macro Economic Data and Monetary policy adjust then you just got your last opportunity to buy Dogecoin relatively cheap. A lot of factors at play and lots of work to do But the risk reward at this level is superb given the circumstances,” Kevin concluded twi weeks ago.
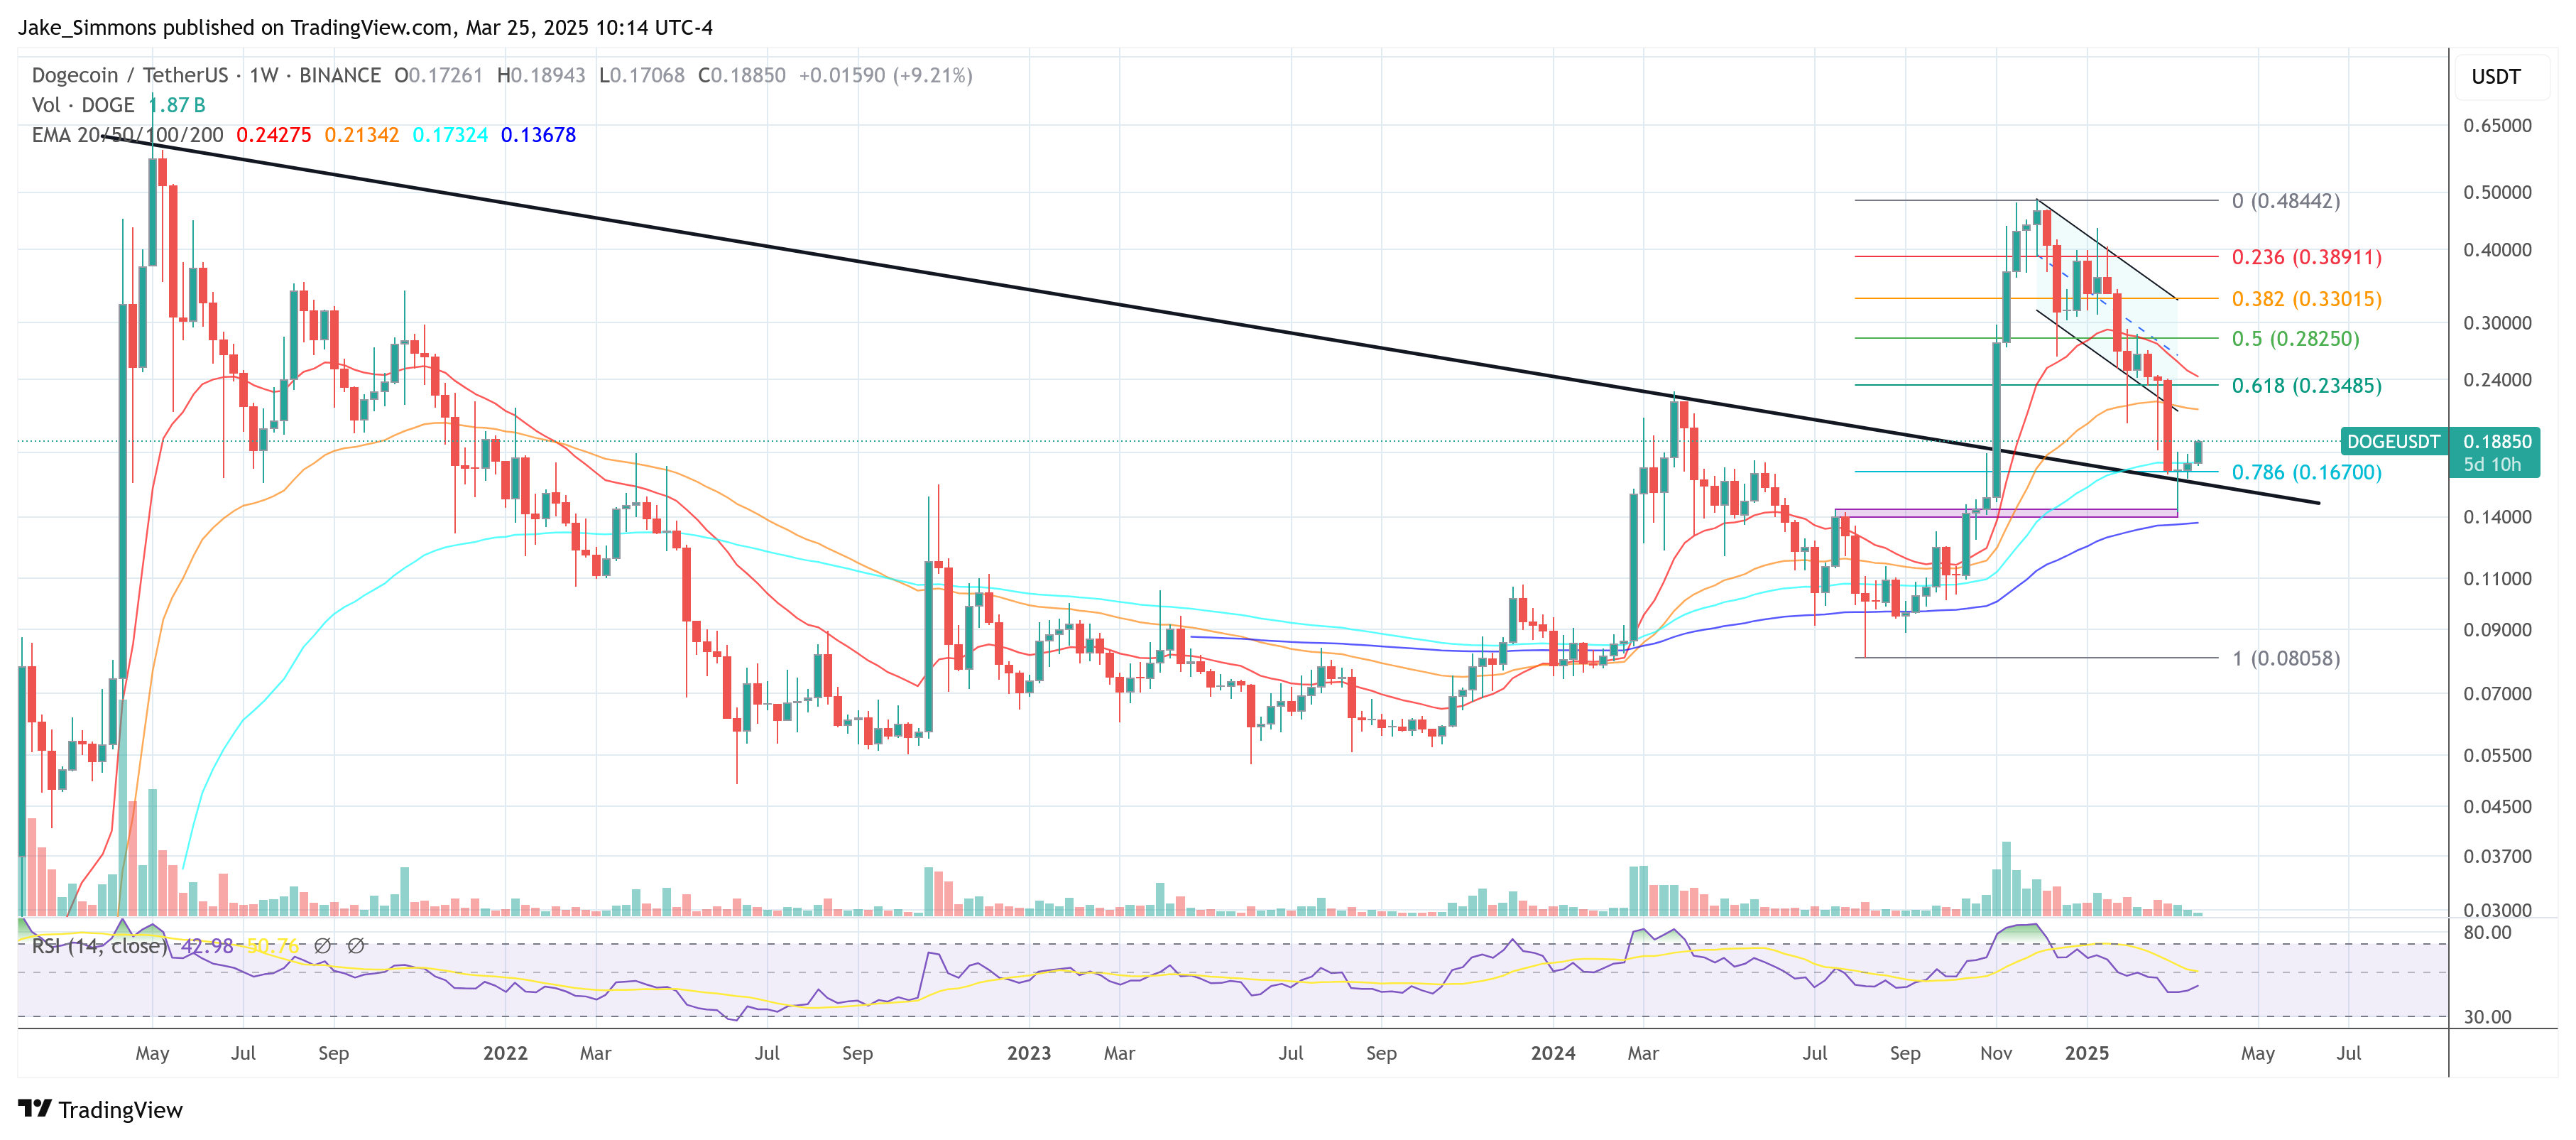
At press time, DOGE traded at $0.1885.