Bitcoin holds gains amid rising BTC ETF net flows, Coinbase premium and Trump tariff rollback
Bitcoin (BTC) price opened the week with strength, rallying to a daily high at $88,804, which was met by praise from analysts who have identified the $90,000 to $92,000 zone as the key price level to hit in the short term.
The market found strength on March 24 after US President Donald Trump suggested that his April 2 “tariff number” announcement could be softer than expected after cars and microchips were removed from the list.
According to Ben Yorke, the vice president of ecosystem at WOO, “The White House’s decision to walk back the threat of broad tariffs and to deploy a more targeted approach suggests Trump is wary of an economic backlash.”
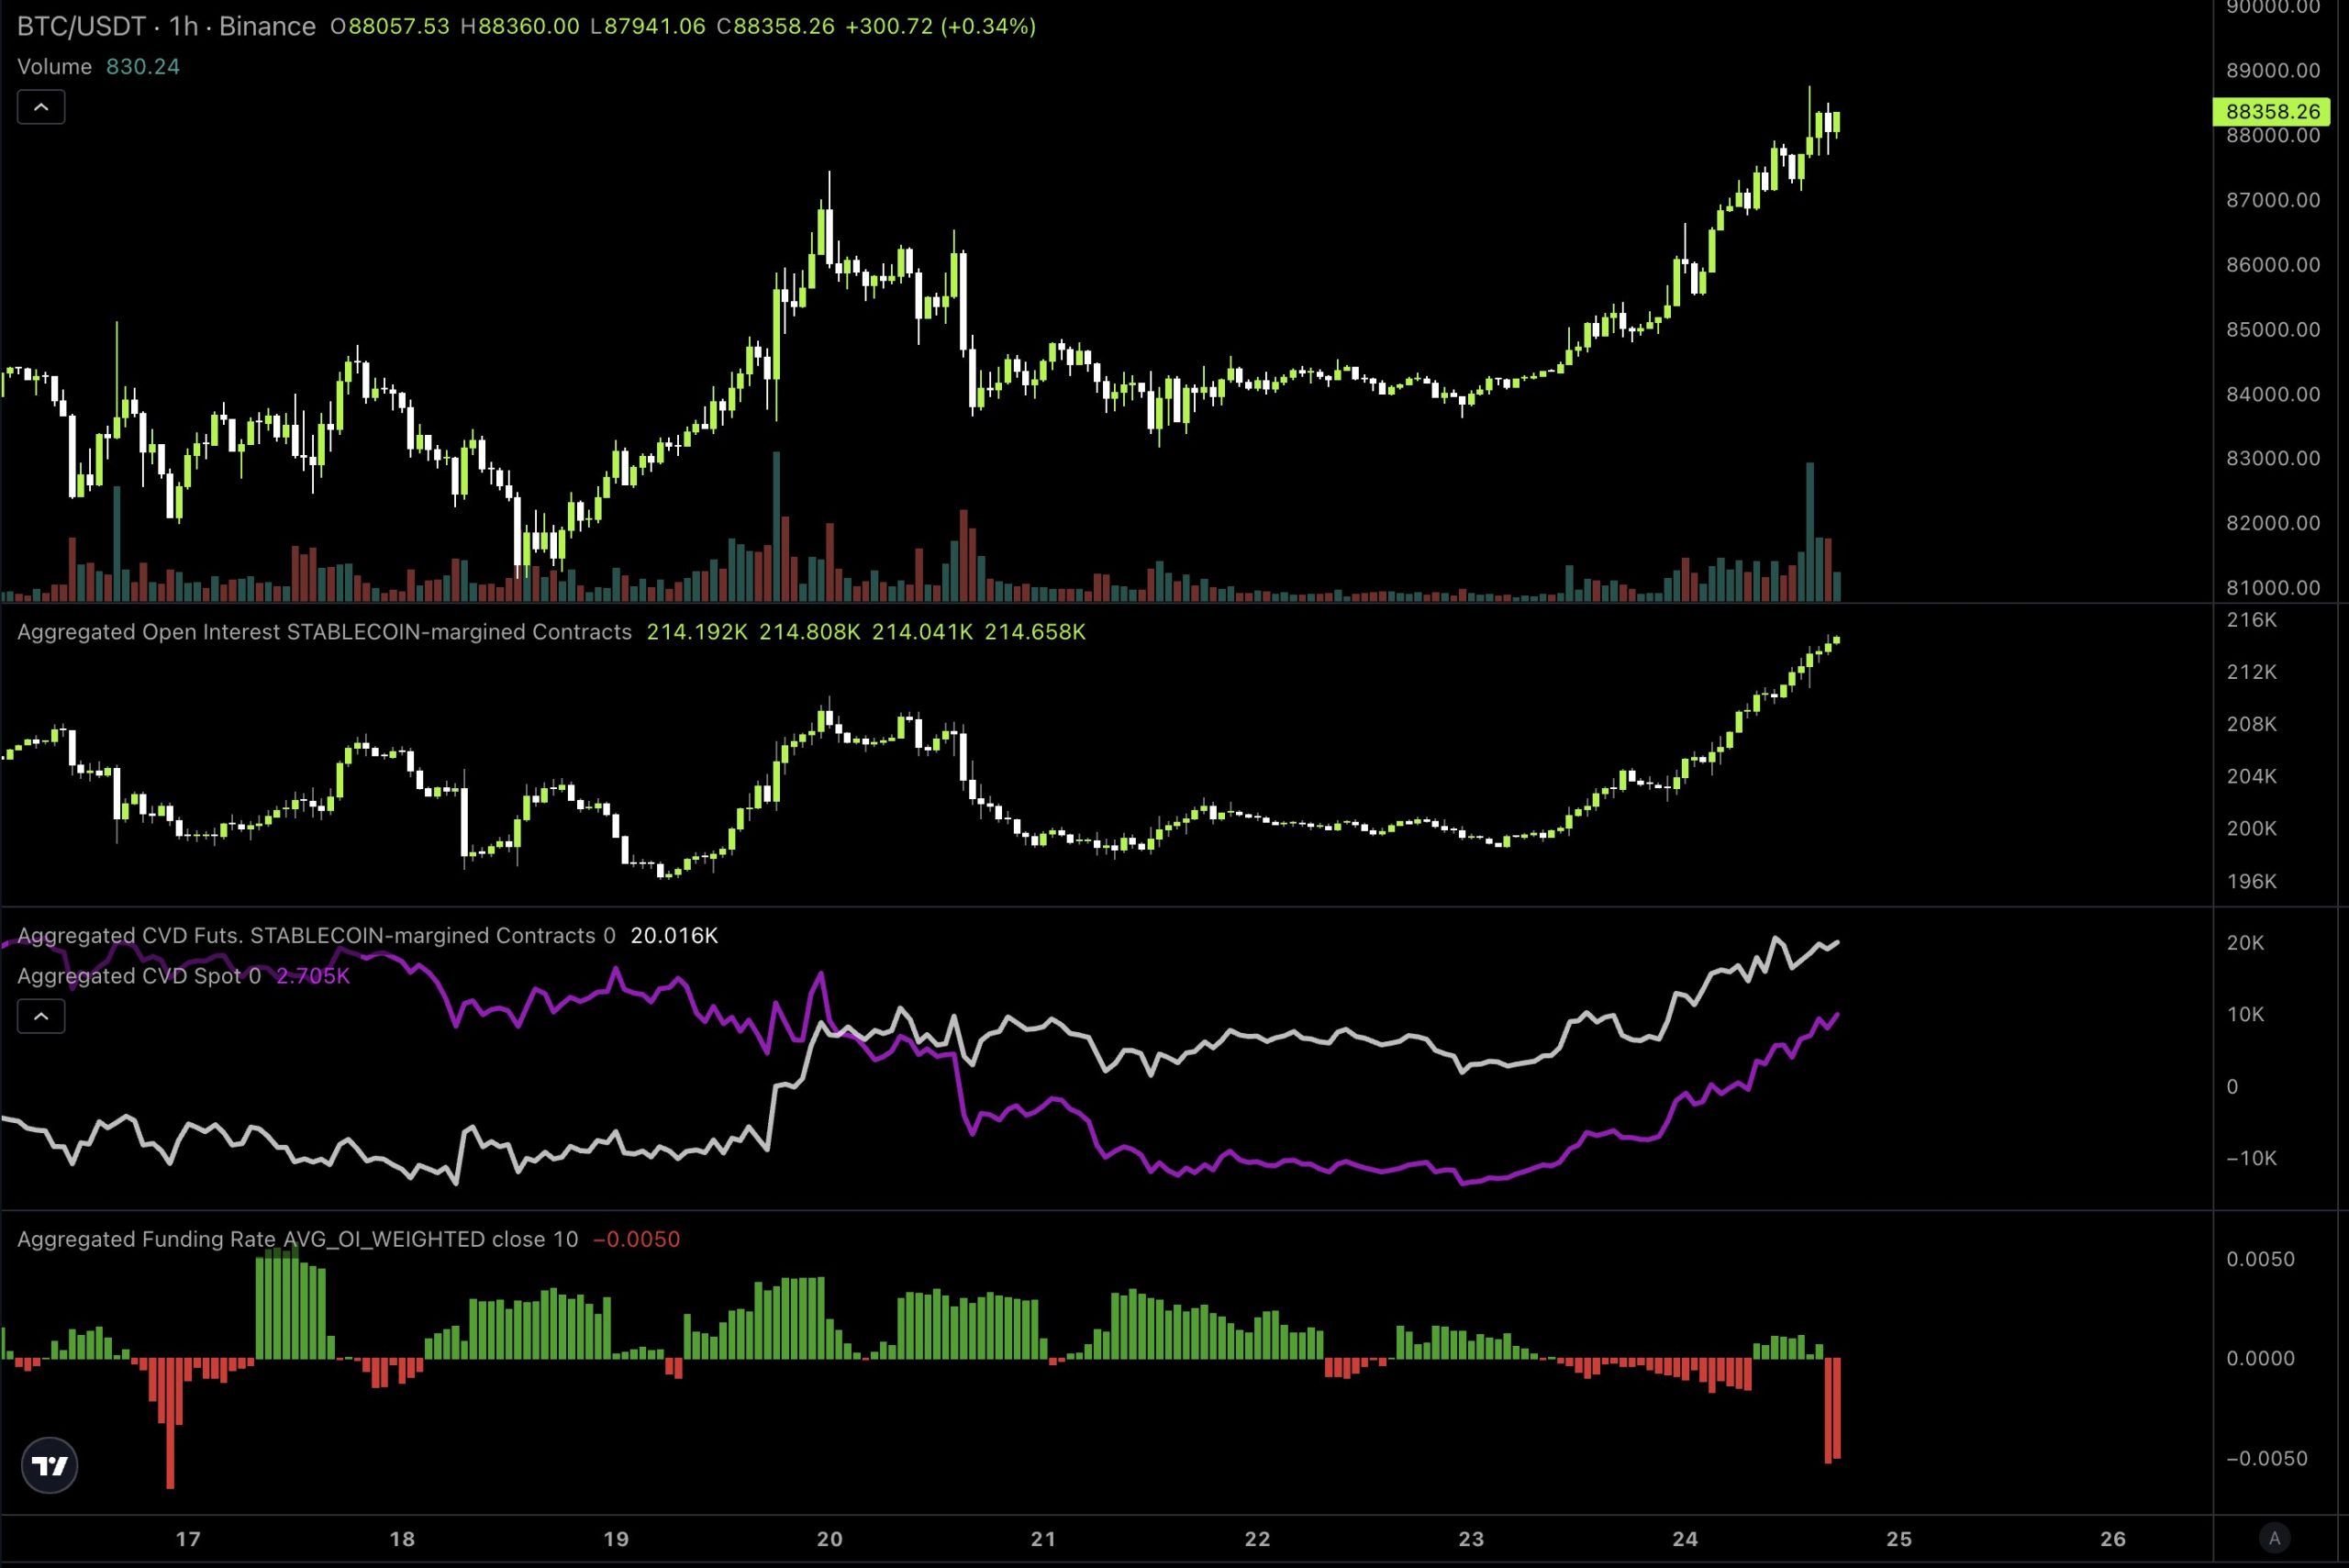
Proof of the market’s positive response to the tariff news can be seen in the increase in Bitcoin futures open interest, where the general assumption is that traders used leverage to open new margin-long positions.
BTC/USDT 1-hour chart. Source: MacroCRG / X
The return of the Coinbase Premium — a measure of the percentage difference between BTC price at Coinbase Pro and Binance — and a 7th consecutive day of spot BTC ETF inflows are also signs that spot demand is returning to the market and could signal an improvement in sentiment as Bitcoin’s last few weeks of price action had been defined by selling and the use of perpetual futures to drive price action within the current range.
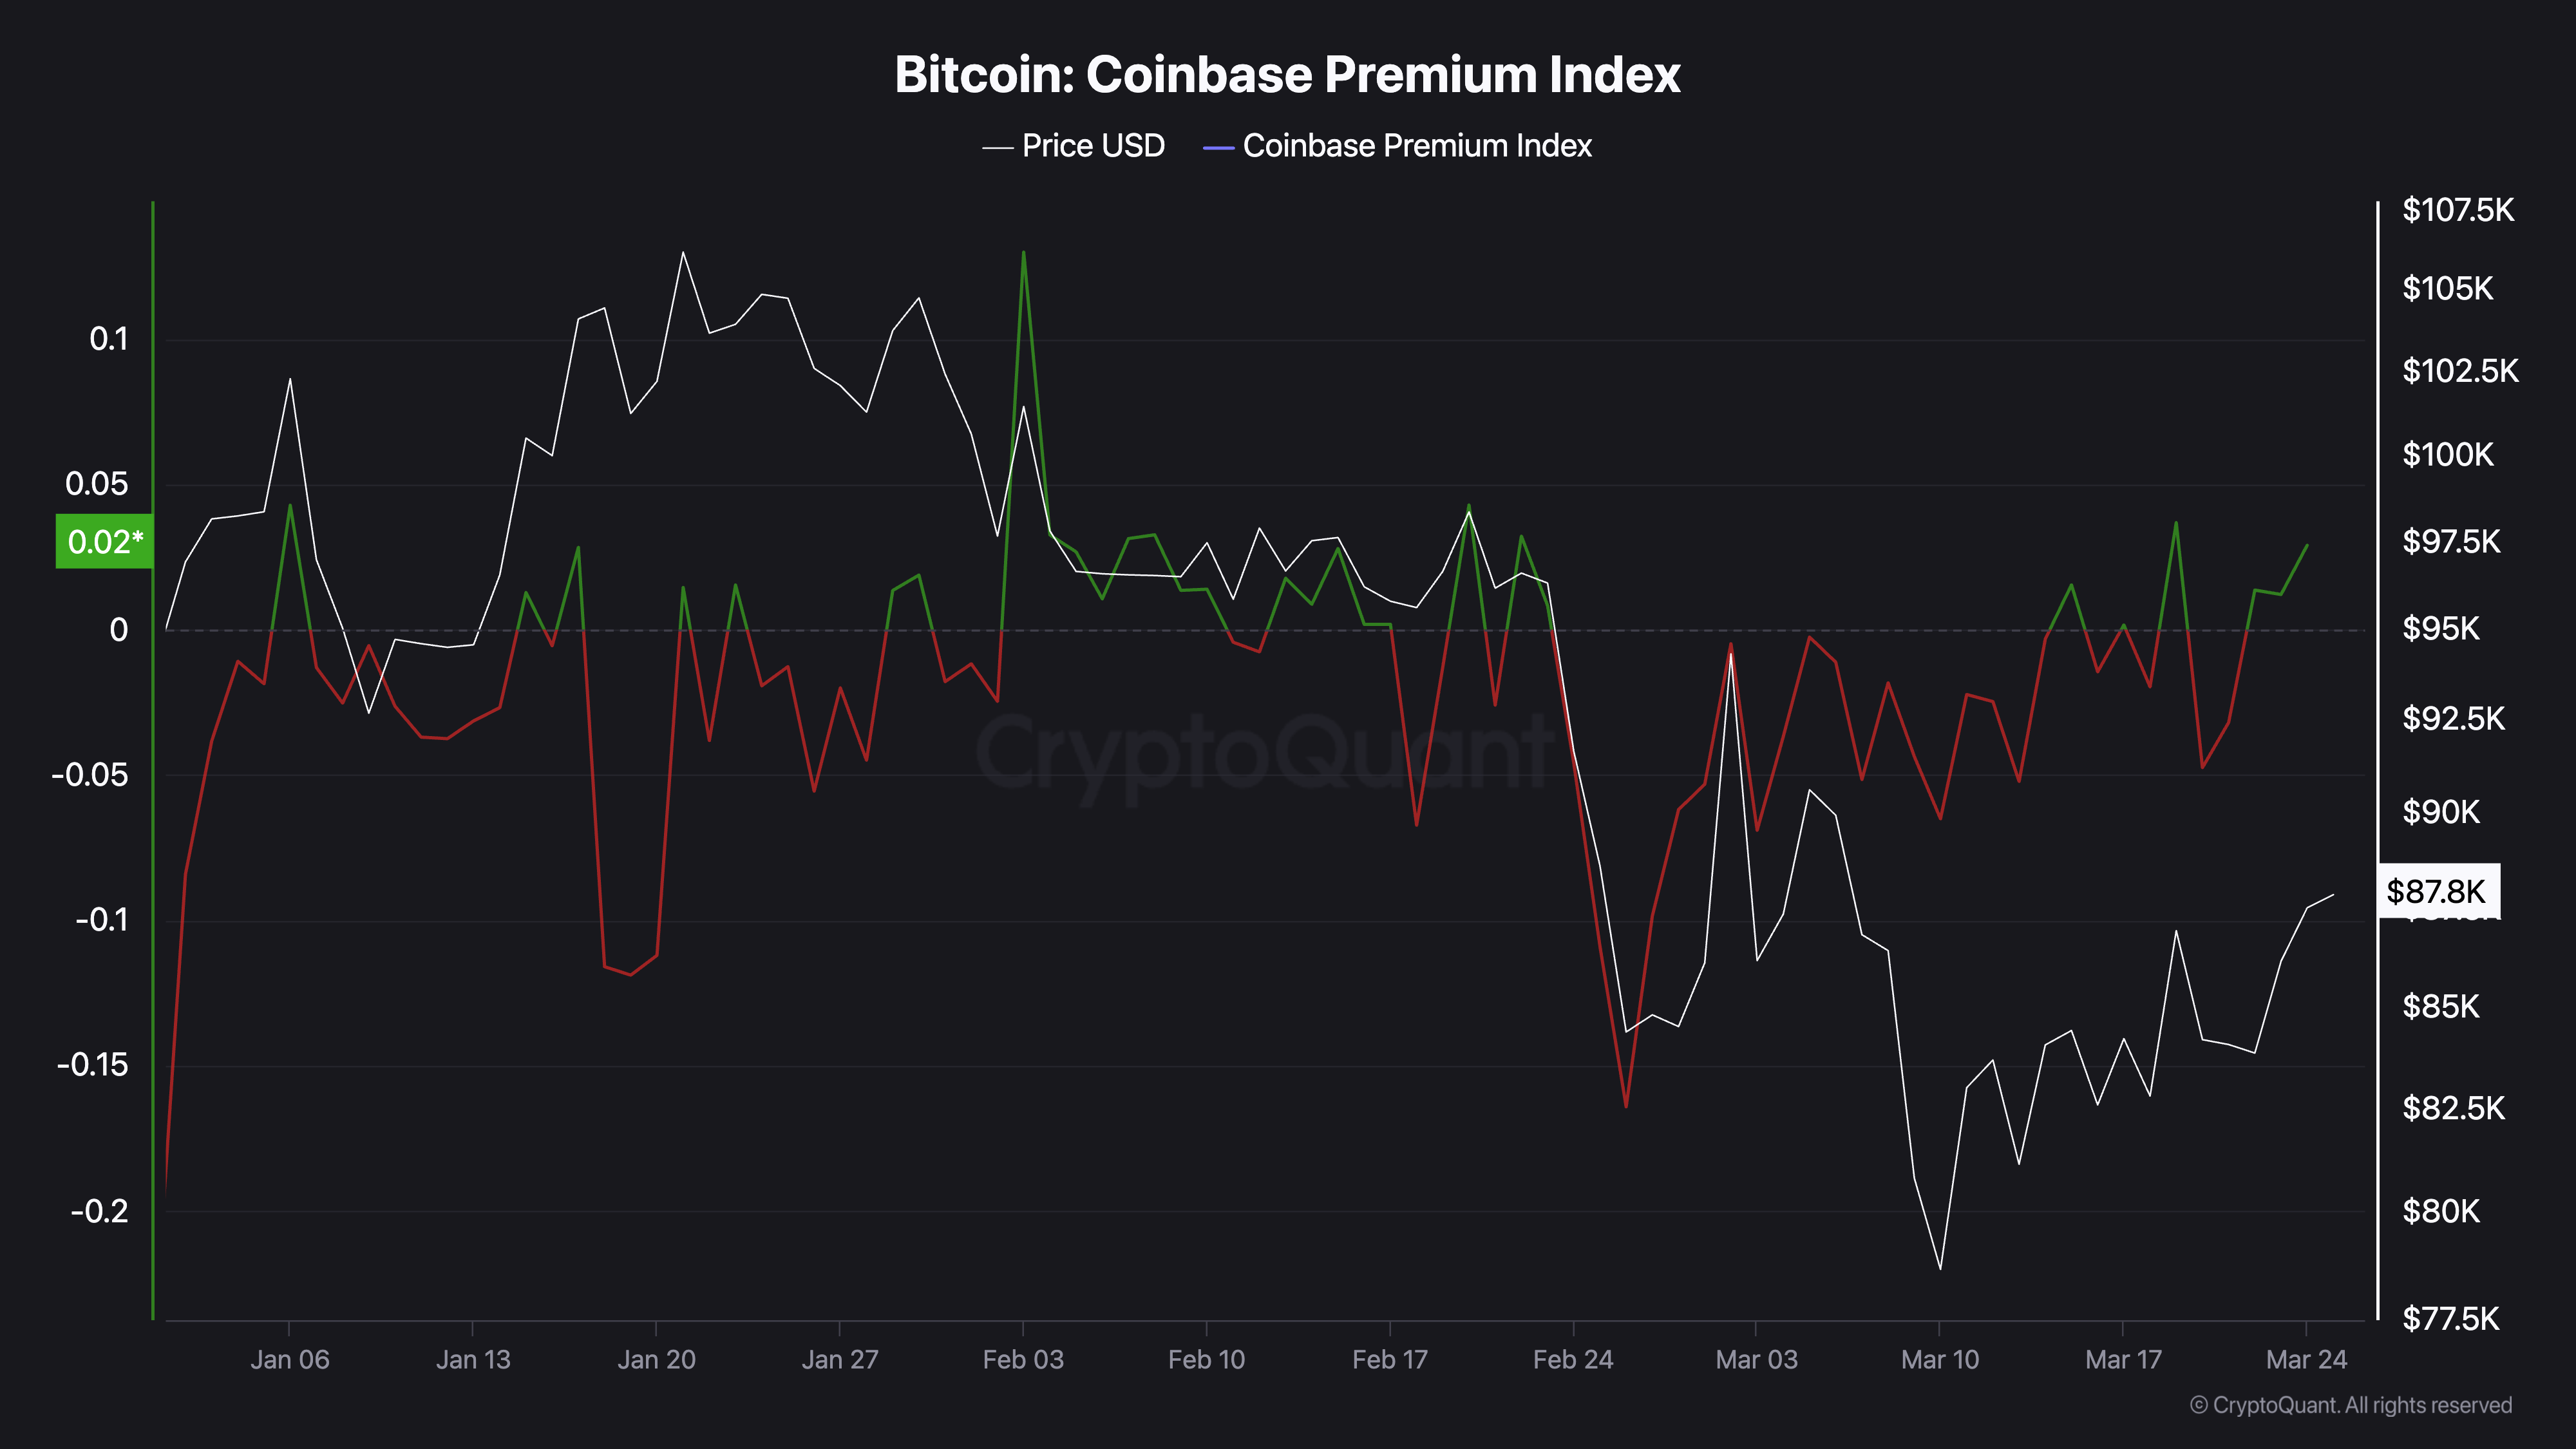
Bitcoin Coinbase premium index. Source: CryptoQuant
Data from SoSoValue shows US spot Bitcoin ETF net flows of $84.17 million.
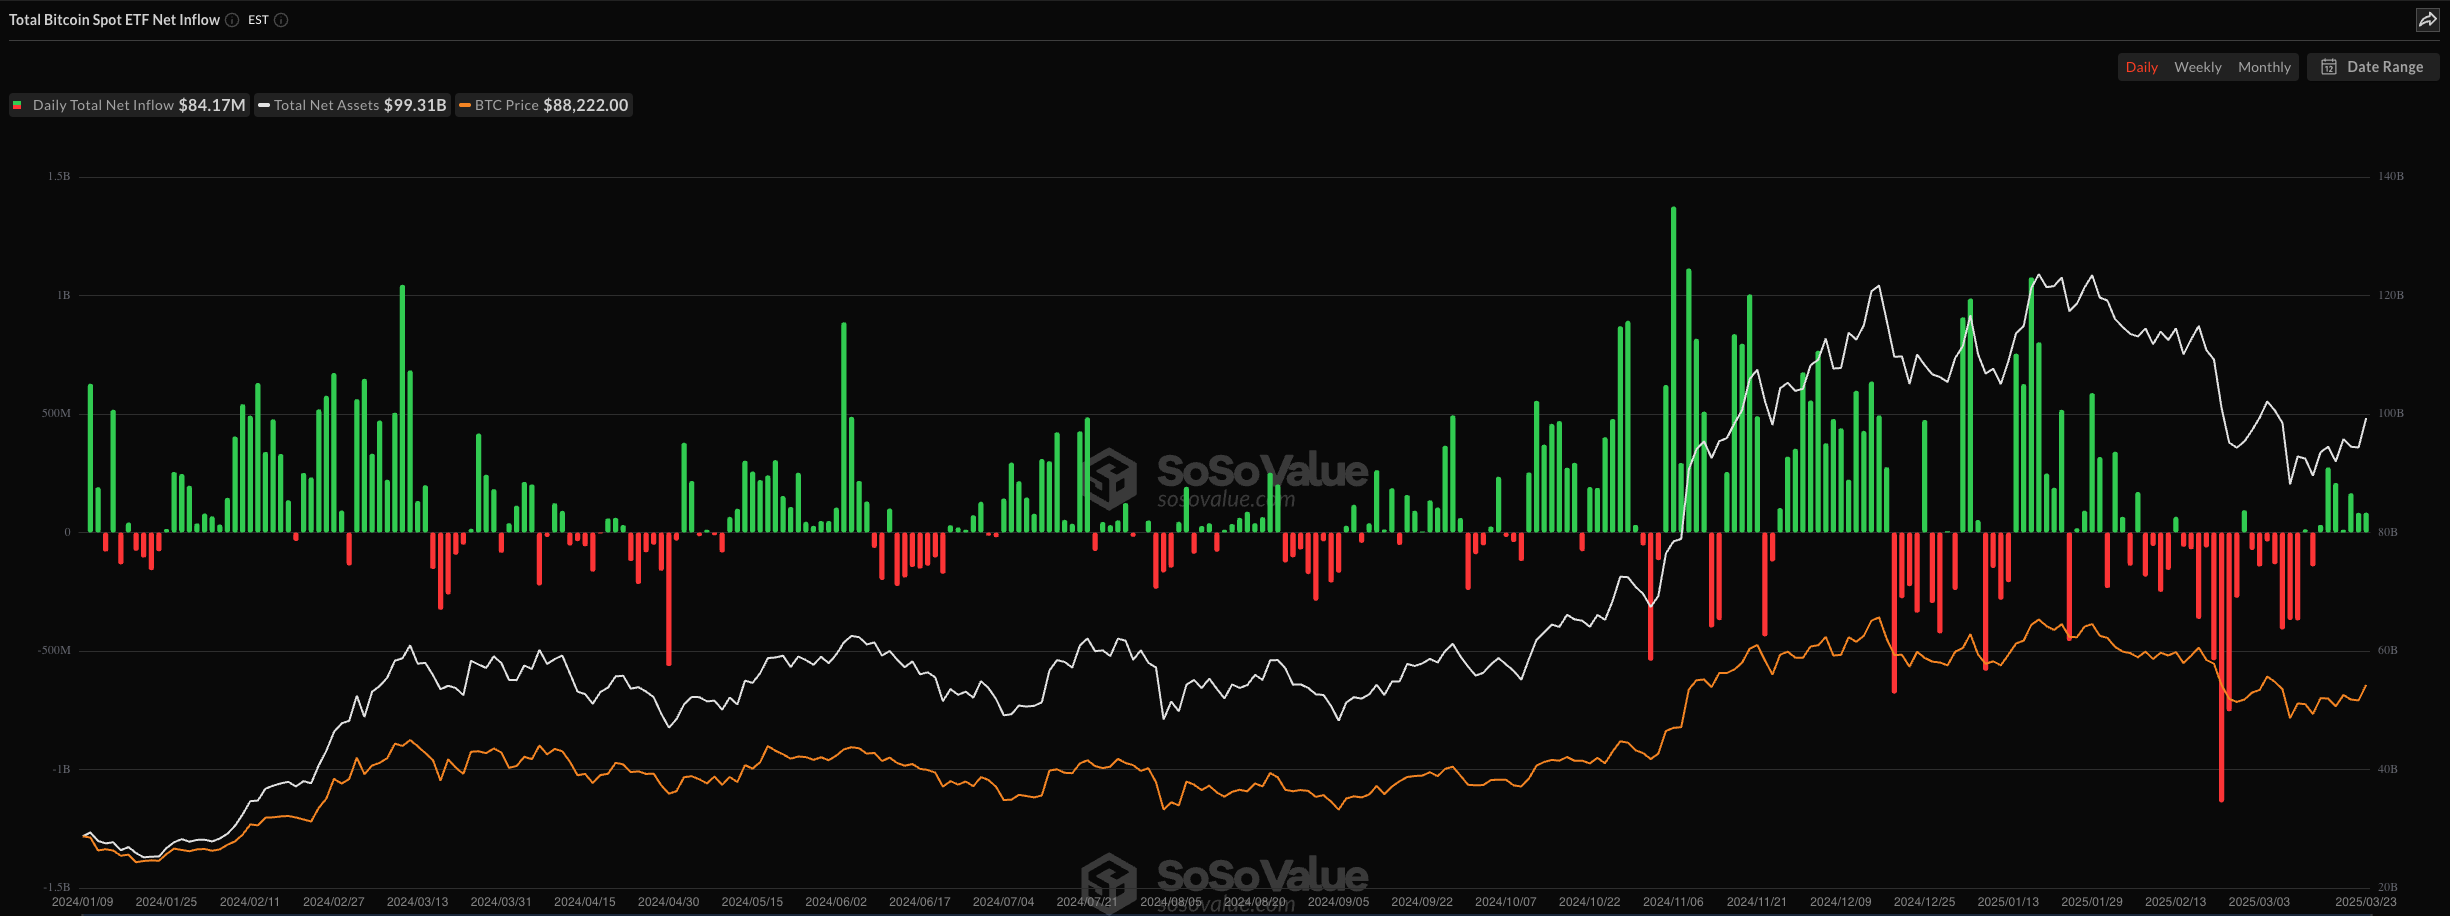
Total spot Bitcoin ETF net inflow. Source: SoSoValue
Is a rally to $100K back on the cards?
While the return of the Coinbase premium and positive net flows to the spot BTC ETFs is a sign of improving sentiment, the question of whether the current bullish momentum has enough energy to push Bitcoin back above $100,000 remains unanswered.
Lingling Jiang, a partner at DWF Labs, said, “We’re witnessing the alignment of both structural and narrative factors driving this upward trend of the movement of Bitcoin.”
Jiang told Cointelegraph,
“At the micro level, we can see a pattern: the resurgence of ETF inflows, the expanding stablecoin market, and breakout patterns across alternative cryptocurrencies collectively signal confidence and perhaps even renewed institutional participation. While market liquidity is strengthening, we notice that volatility remains subdued, and onchain metrics reveal long-term investors accumulating rather than divesting.”
Related: Bitcoin sets sights on ‘spoofy’ $90K resistance in new BTC price boost
From a technical point of view, Bitcoin continues to trade below the range that had defined its price action from November 2024 until February 2025. While the price trades above the 20-day and 200-day moving average, it remains capped at the descending trendline resistance, which is also aligned with the 50-day moving average ($89,500 – $90,000).

BTC/USDT 1-day chart. Source: TradingView
According to independent market analyst Scott Melker, Bitcoin’s 4-hour relative strength index indicator has shown a “clear bullish trend, with a series of higher lows and higher highs.”
In a March 24 X post, Melker said,
“All of this preceded by [an] oversold RSI with bullish divergence at the bottom on daily and below. Which I was screaming about.”
This article does not contain investment advice or recommendations. Every investment and trading move involves risk, and readers should conduct their own research when making a decision.