Bitcoin Repeats Historic Pattern—Is a Breakout Toward $100K Next?
Bitcoin and the broader cryptocurrency market have shown strong recovery, with Bitcoin surpassing $93,000 earlier today after an increase of nearly 10% in the past 24 hours.
The surge follows the announcement of a US crypto strategic reserve, which is expected to include major digital assets such as BTC, ETH, SOL, XRP, and ADA.
The news has fueled optimism in the market, pushing Bitcoin back above the $90,000 level. As Bitcoin’s price movement gains momentum, analysts appear to have been closely examining the ongoing correction phase within the current bullish cycle.
CryptoQuant analyst Grizzly has shared insights into Bitcoin’s historical price behavior, suggesting that the asset may be repeating past patterns that preceded significant rallies. If these trends hold, BTC could be positioning itself for a major breakout in the coming months.
BTC’s Historical Price Patterns and Market Outlook
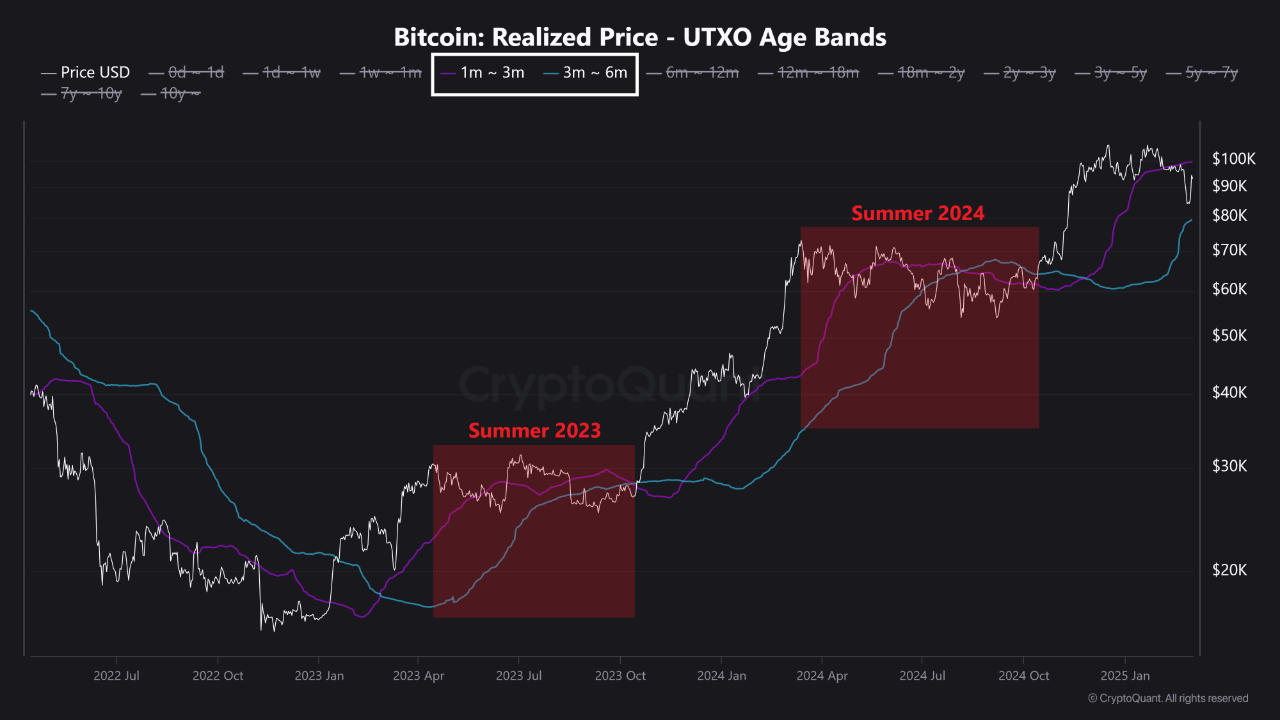
According to Grizzly, Bitcoin is currently in its third corrective phase within the bullish cycle that began in early 2023. This pattern has been observed using the UTXO Age Bands—a metric tracking how long BTC remains unmoved in wallets.
Similar corrective phases took place in the summers of 2023 and 2024, each lasting around six months. During these periods, BTC experienced resistance before eventually breaking out into new price highs.
Grizzly revealed that if this trend continues, BTC may remain in a consolidation phase for another two to three months, fluctuating between $80,000 and $100,000. A breakout beyond $100,000 could mark the end of the correction and potentially push BTC toward $130,000, as historical data suggests.
The CryptoQuant analyst noted:
Market participants should closely watch the structural dynamics of the premium bands, as a confirmed break above resistance could signal the next parabolic leg of Bitcoin’s bull market.
Bitcoin’s Path to $100K: What Market Indicators Suggest
Another CryptoQuant analyst, OnChainSchool, has provided further insights into BTC’s potential price movement beyond $100,000. The analyst highlights the MVRV Z-Score, a metric that tracks Bitcoin’s valuation in comparison to its historical fair value.
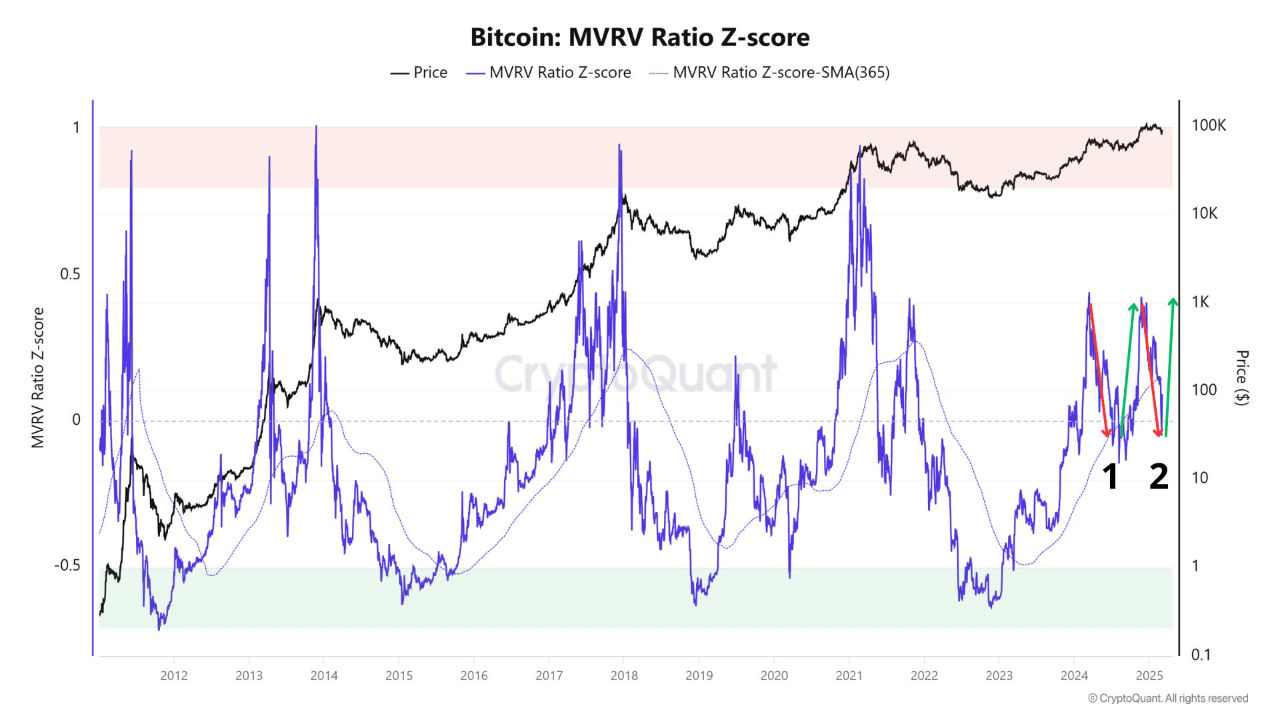
According to the analyst. the current cooldown in the MVRV Z-Score indicates that Bitcoin could soon enter a rapid upward trajectory, similar to the price action observed in early 2024 when BTC surged past $72,000 to new all-time highs.
However, unlike past cycles, the market appears to be moving at a faster pace, potentially influenced by the evolving political landscape in the US.
With increasing attention on cryptocurrency from policymakers and institutional investors, there is a likelihood that BTC could break past its previous all-time high sooner than expected.
Whether this acceleration will be sustained depends on multiple factors, including regulatory developments, macroeconomic conditions, and continued market demand for Bitcoin as a hedge asset.
Featured image created with DALL-E, Chart from TradingView