Bitcoin Price Restarts Decline, Can BTC Bulls Protect $60K?
Bitcoin price started another decline from the $67,000 zone. BTC is showing bearish signs and might soon revisit the $61,000 support zone.
- Bitcoin failed to clear the $67,000 resistance zone.
- The price is trading below $65,000 and the 100 hourly Simple moving average.
- There was a break below a rising channel with support at $64,900 on the hourly chart of the BTC/USD pair (data feed from Kraken).
- The pair could extend its decline unless it clears the $65,000 resistance zone.
Bitcoin Price Recovery Stalls
Bitcoin price attempted a recovery wave above the $65,000 resistance zone. BTC even climbed above $66,200, but the bears were active near the $67,000 zone.
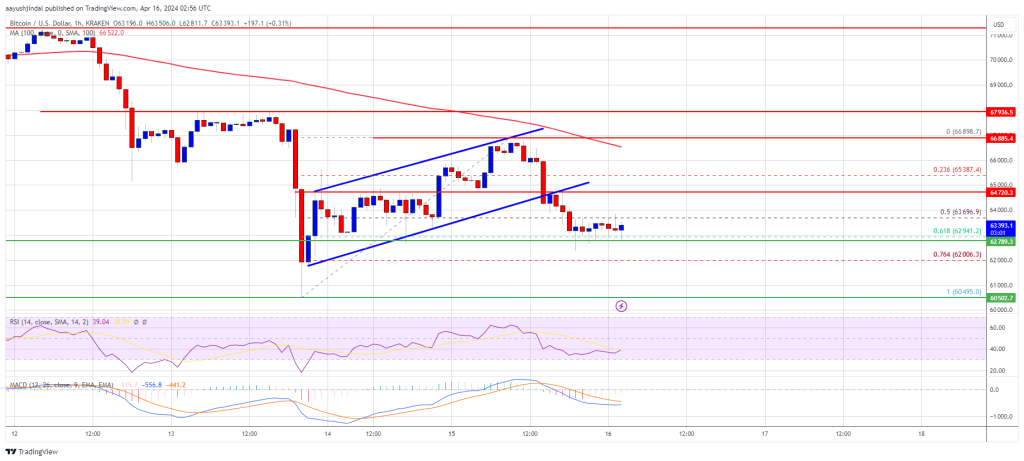
A high was formed at $66,898 and the price started another decline amid rising tensions between Israel and Iran. There was a move below the $65,000 and $64,000 levels. The price traded below the 50% Fib retracement level of the upward move from the $60,495 swing low to the $66,898 high.
There was a break below a rising channel with support at $64,900 on the hourly chart of the BTC/USD pair. Bitcoin is now trading below $65,000 and the 100 hourly Simple moving average. The bulls are now protecting the 61.8% Fib retracement level of the upward move from the $60,495 swing low to the $66,898 high at $63,000.
Immediate resistance is near the $63,750 level. The first major resistance could be $64,700. The next resistance now sits at $65,000. If there is a clear move above the $65,000 resistance zone, the price could continue to move up. In the stated case, the price could rise toward $66,800 and the 100 hourly Simple moving average.
Source: BTCUSD on TradingView.com
The next major resistance is near the $67,200 zone. Any more gains might send Bitcoin toward the $70,000 resistance zone in the near term.
More Losses In BTC?
If Bitcoin fails to rise above the $65,000 resistance zone, it could start another decline. Immediate support on the downside is near the $63,000 level.
The first major support is $62,000. If there is a close below $62,000, the price could start to drop toward the $61,000 level. Any more losses might send the price toward the $60,500 support zone in the near term.
Technical indicators:
Hourly MACD – The MACD is now losing pace in the bearish zone.
Hourly RSI (Relative Strength Index) – The RSI for BTC/USD is now below the 50 level.
Major Support Levels – $63,000, followed by $62,000.
Major Resistance Levels – $64,700, $65,000, and $67,000.