Here’s How Current Bitcoin Capitulation Compares With Past Crashes
On-chain data shows that Bitcoin short-term holders are depositing 0.82% of their supply to exchanges. Here’s how these inflows compare with past crashes.
Bitcoin Short-Term Holder Inflows Have Been Elevated Recently
The BTC market can be divided into two broad investor groups, one of which is the “short-term holder (STHs) cohort.” The STHs are investors who have been holding onto their coins since less than 155 days ago.
Generally, the Bitcoin holders belonging to this group are the weakest hands in the market, as they may easily sell at the sight of any sharp volatility or uncertainty in the market.
The opposite cohort is called the “long-term holder (LTH) group,” and it naturally includes all participants that have been carrying their BTC in their wallets since more than 155 days ago.
These LTHs usually hold for large stretches of times, and they are the diamond hands in the sector who need to be pushed a lot before they start panic selling their coins.
Recently, the Bitcoin market has observed the emergence of FUD in the market, as a result of the US Securities and Exchange Commission (SEC) suing cryptocurrency exchanges Binance and Coinbase.
The market has acted volatile in both directions, but overall the price of the asset has gone down since the volatility has arrived. Obviously, in times like these, the STHs would be the first ones to break.
In a new tweet, the on-chain analytics firm Glassnode has looked at the exchange inflow data of the STHs, to see how they are coping with the current situation.
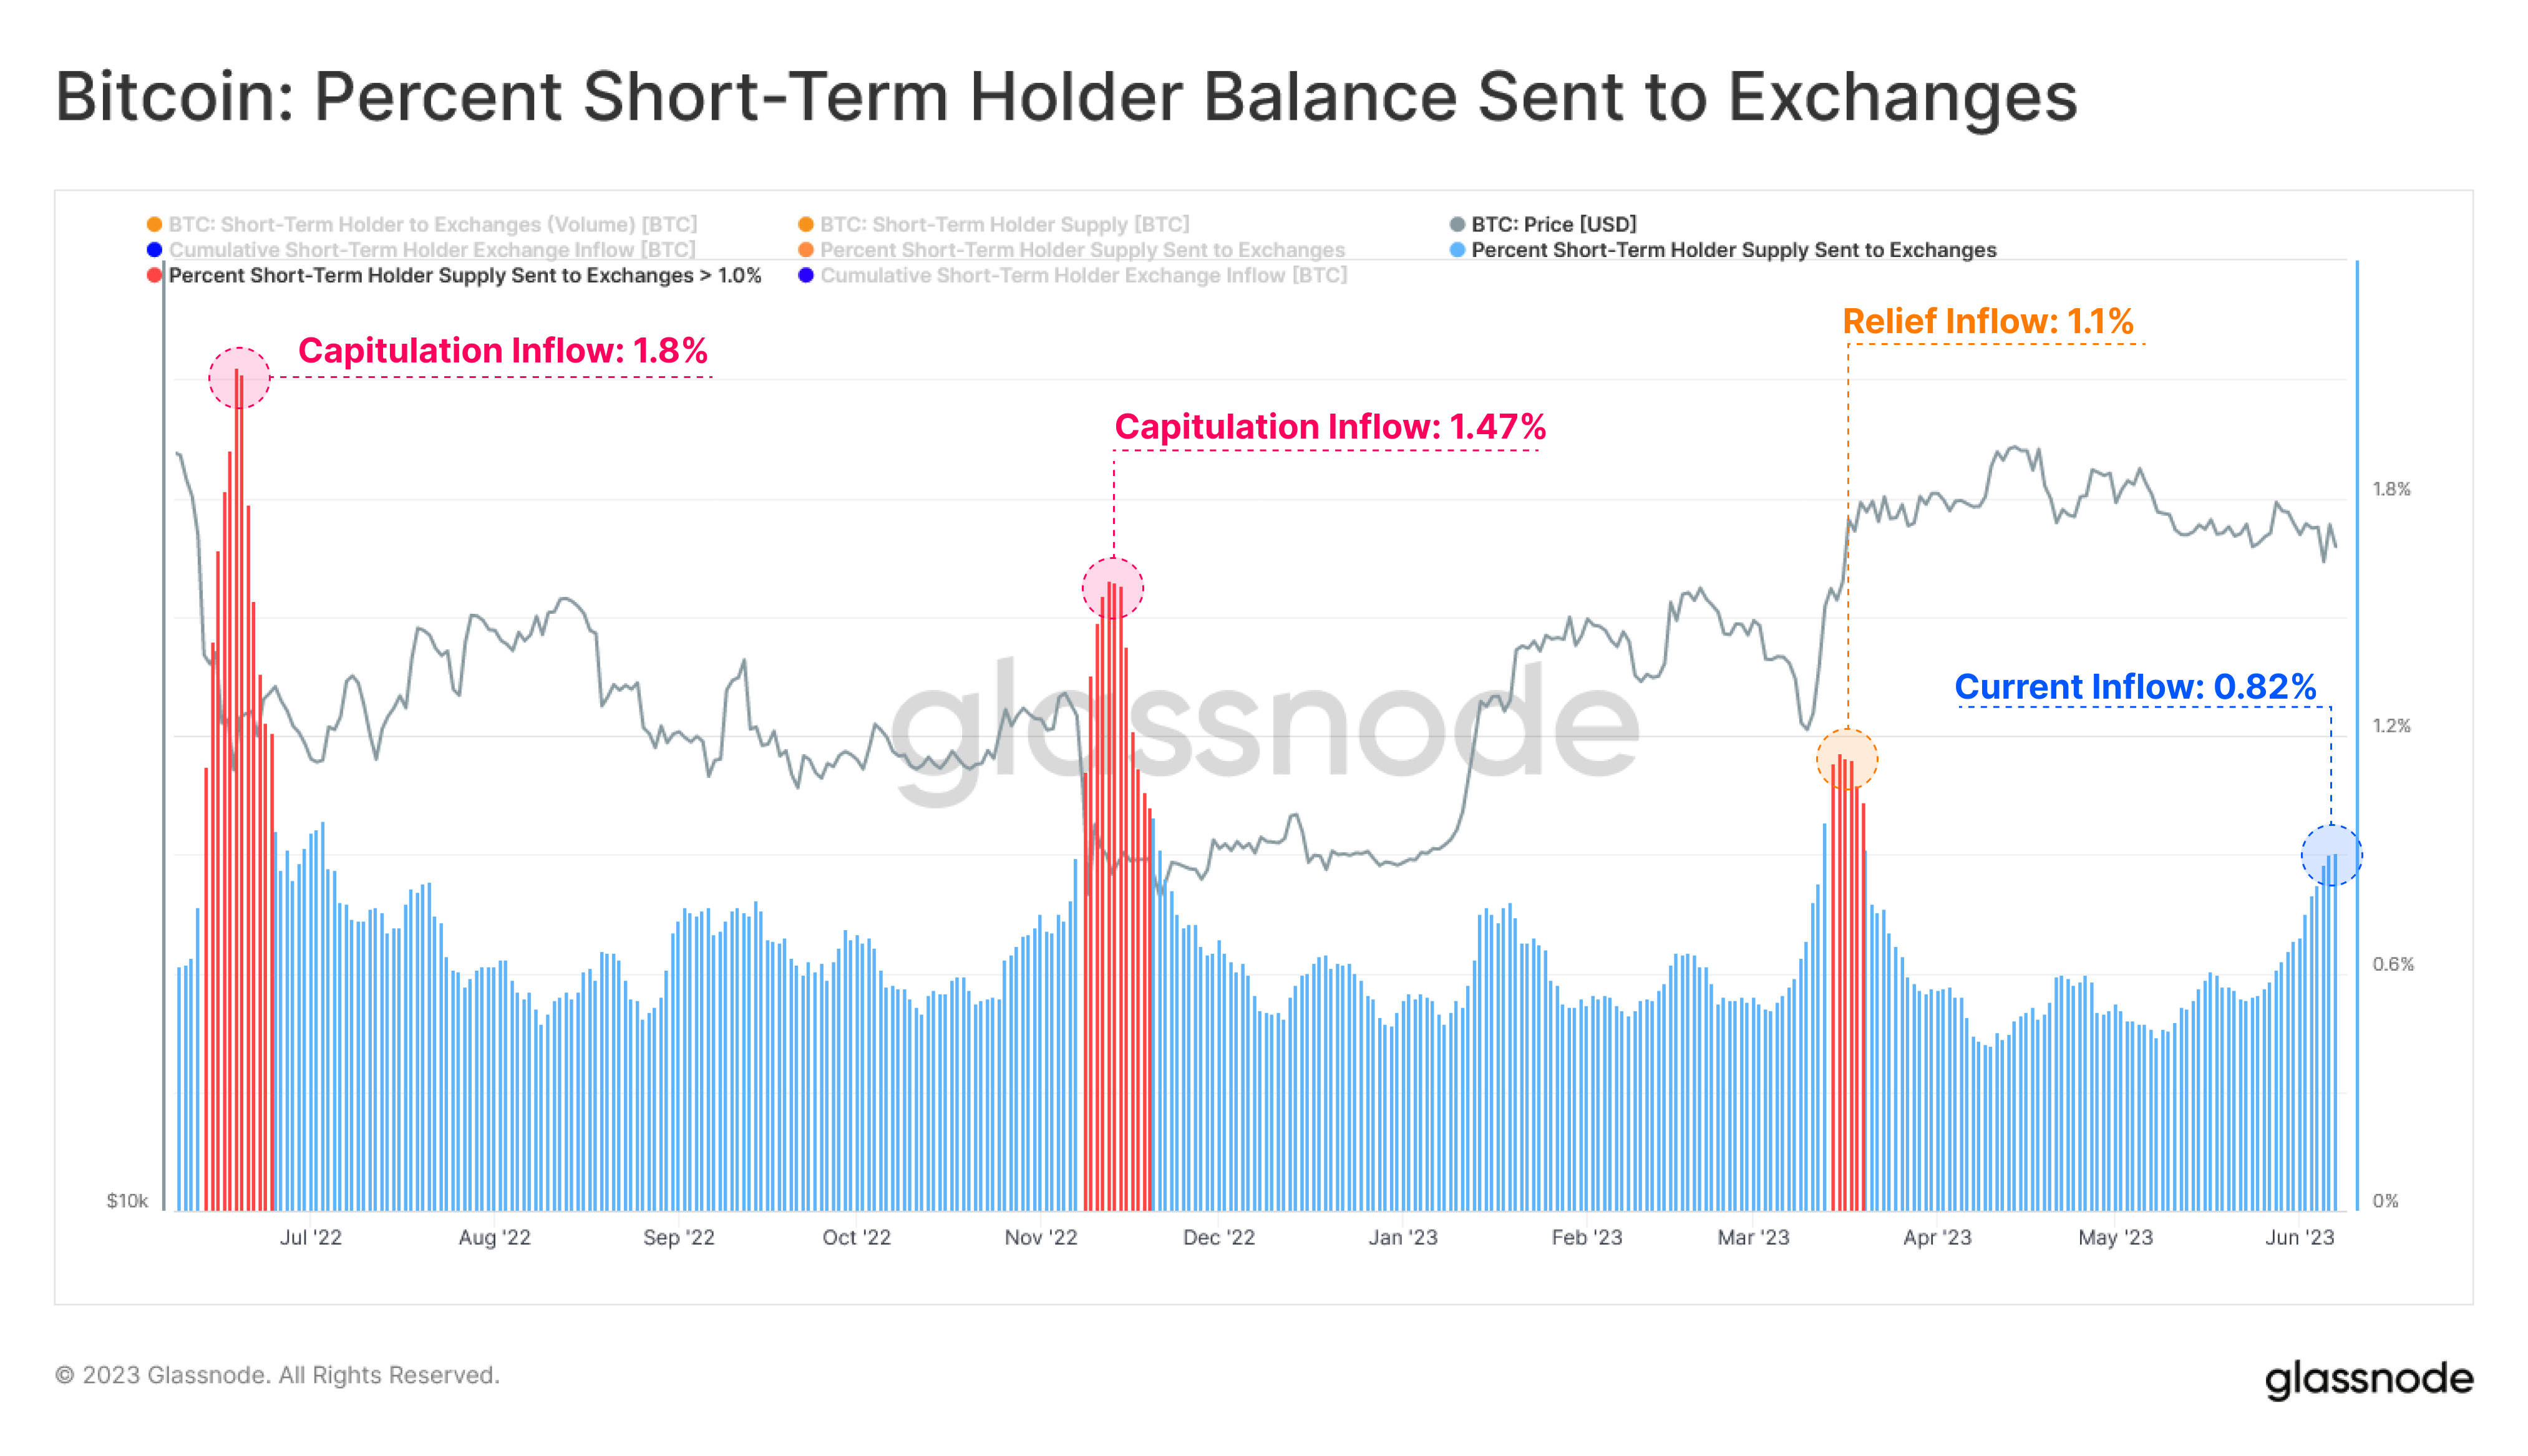
The below chart shows the trend in the Bitcoin exchange inflow for these investors over the past year:
As you can see in the above graph, the Bitcoin exchange inflow for the STHs has been climbing recently and has now hit relatively high levels. The “exchange inflow” here refers to a metric that tracks the amount of the asset that these investors have been depositing into the wallets of centralized exchanges.
One of the main reasons why investors transfer their coins to these platforms is for selling-related purposes, so the exchange inflow data for these holders can provide us with hints about their current selling behavior.
In the context of the current discussion, a modified version of the exchange inflow is being used; one that measures the inflows in terms of the percentage of the total STH Bitcoin supply.
The STH exchange inflow has hit a value of 0.82% recently, meaning that these investors have recently been sending around 0.82% of their supply to these platforms.
This is certainly not a small value, but when compared to other panic selling events in the past year, namely the LUNA collapse, the FTX crash, and the relief rally in March 2023 (all marked with red on the chart), the current inflows are still quite low.
This would mean that the latest uncertainty in the Bitcoin market hasn’t yet been enough to push the STHs into capitulating at levels similar to historical capitulation events.
BTC Price
At the time of writing, Bitcoin is trading around $26,600, down 2% in the last week.