The Ultimate indicator: Bitcoin has reclaimed the territory of the broken Rainbow Chart, lets get the rally started to $1M!
| |
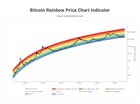
This bear market has certainly been the one to break many many long-lasting indicators for the BTC and Crypto prices. Many crypto indicators that have been very well calculated with hundreds of lines of code and calculation have ben broke but one just resurrected itself. The almighty, highly scientific and visually awesome-looking Rainbow Chart. For a basic understanding, the Rainbow Chart is just like a regression line for when the price is overvalued or undervalued. Historically people have been flaunting quite a lot that the blue area is when the price is basically on a fire-sale and you should definitely buy. The past times this perfectly predicted the bottom but this time we actually went below the blue area and thus below the whole rainbow chart. Rainbow Chart from lookintobitcoin (may have to zoom in a bit) But now there has been the great resurrection! With the recent bounce we have officially gotten back into the Rainbow Chart and a lot of analysts are already seeing this as the great victory and a sign that the bear market is over. Its quite new to me that getting back into a broken indicator is so meaningful but they are saying it, so it must be true. With that I have now yolo-ed in for a 100x leverage on BTC and wont leave until we hit $1M as the almighty rainbow chart predicts. submitted by /u/partymsl |