Key Support Line For Cardano Price Rests Here As The Coin Moves South
The Cardano price has declined steeply over the past trading sessions. The altcoin currently trades within a descending triangle pattern. This means that the coin could be headed for further decline unless it manages to break past a few vital price ceilings.
Over the last 24 hours, ADA declined by 1.3%. In a weekly timeframe, the altcoin price has been hovering around the same range. In recent weeks, the Cardano price has reached new highs. This reading is tied to bullish price action; however, the bulls lost vigor.
It is safe to say that ADA is, at the moment, in a price correction phase. ADA mustn’t lose two of its essential price floors. This would mean that the bears could be taking over. Since the coin currently depicts a descending wedge, it could be possible that ADA might touch its closest support level.
After revisiting the support line, it is likely to bounce back again. The altcoin’s market capitalization has also noted a decline, which corresponds with a fall in the asset price.
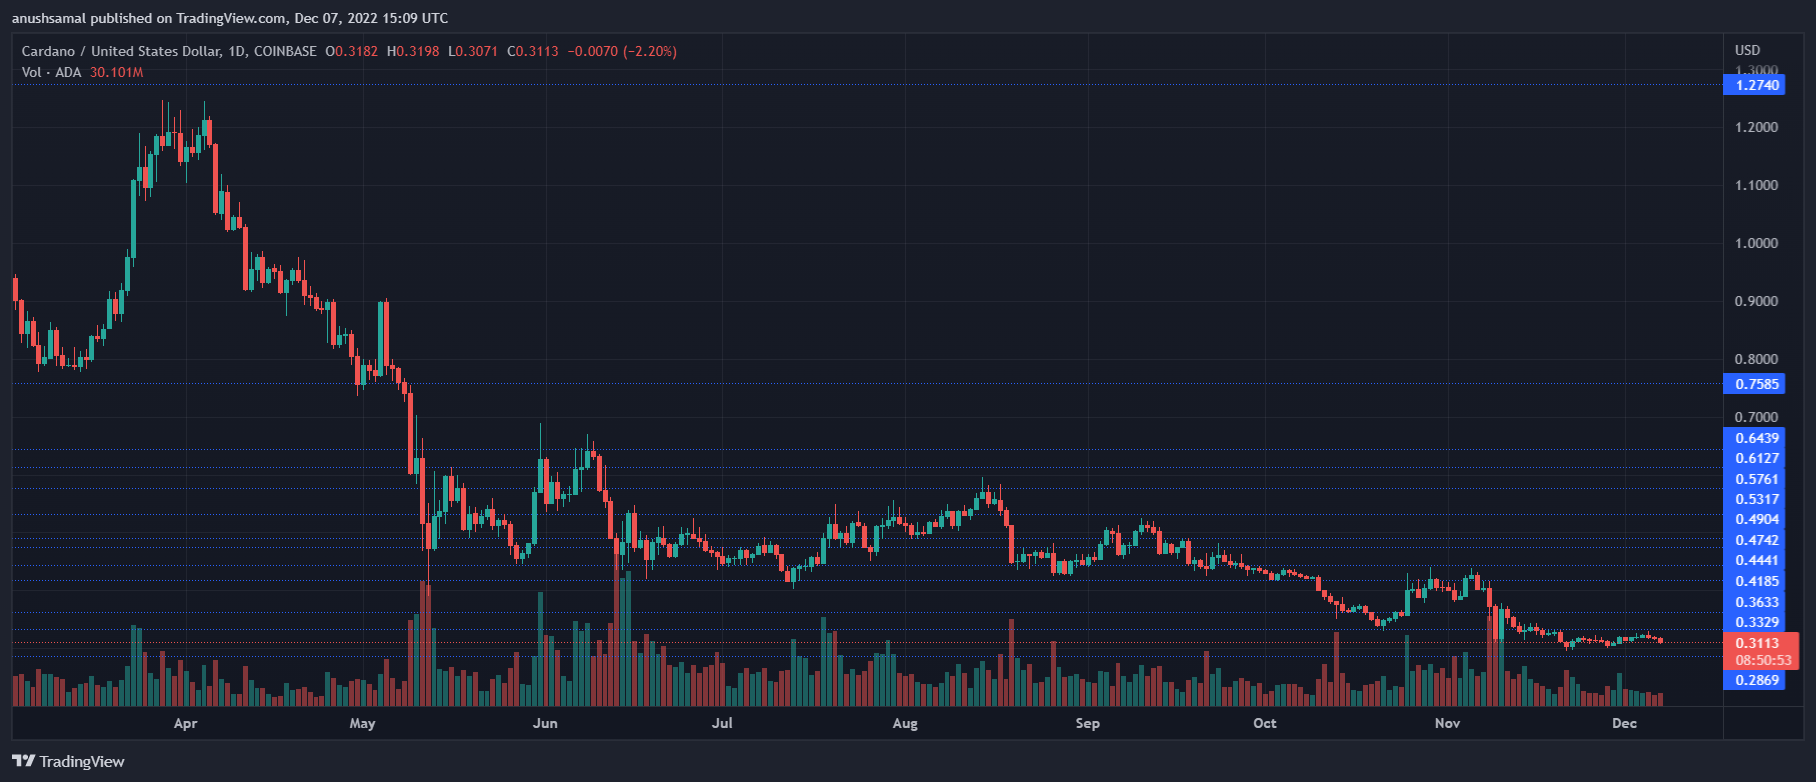
Cardano Price Analysis: One-Day Chart
ADA was exchanging hands at $0.31 at press time. The immediate resistance for Cardano was at $0.34; the bulls tested this level, but the altcoin met with selling pressure. The two major resistance levels for the coin stand at $0.34 and $0.36, respectively.
ADA was trading extremely close to its crucial support line of $0.30. The bulls might lose stamina, pushing the coin to $0.28. Cardano’s price will plummet if it fails to stay above the $0.28 mark. The amount of ADA traded in the last session increased and was red, depicting bearish sentiment and selling strength.
Technical Analysis
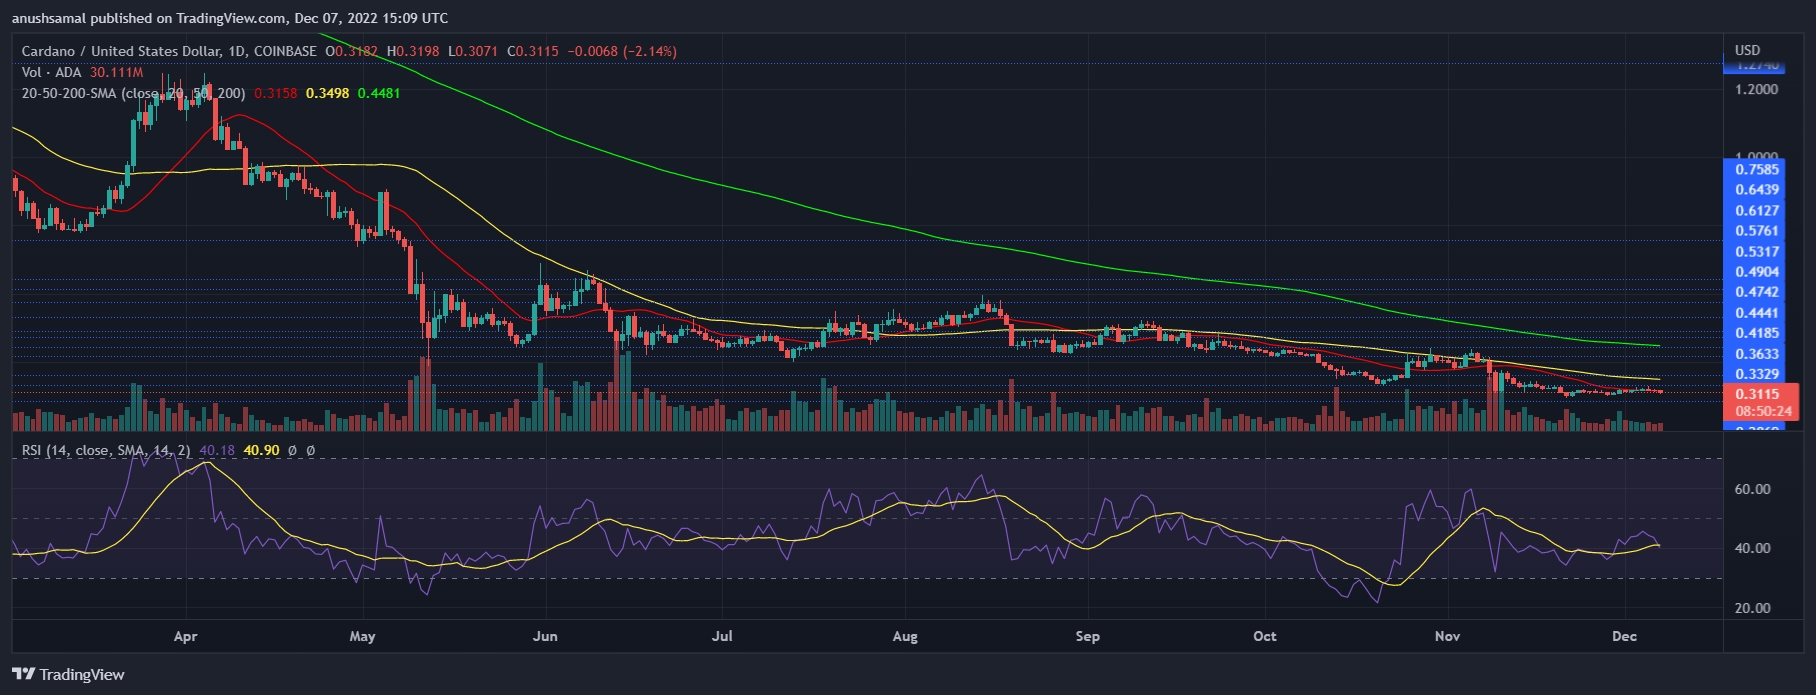
Investor confidence in the altcoin has been steadily declining in recent months, and despite ADA making slight progress, demand has languished in recent weeks. The Relative Strength Index fell below the 40-mark and was nearing oversold territory. In this case, ADA could fall through at $0.28.
Due to lower demand, the Cardano price moved below the 20-Simple Moving Average line. This meant that sellers were driving the price momentum in the market. Movement above the 20-SMA line will help buyers regain confidence.
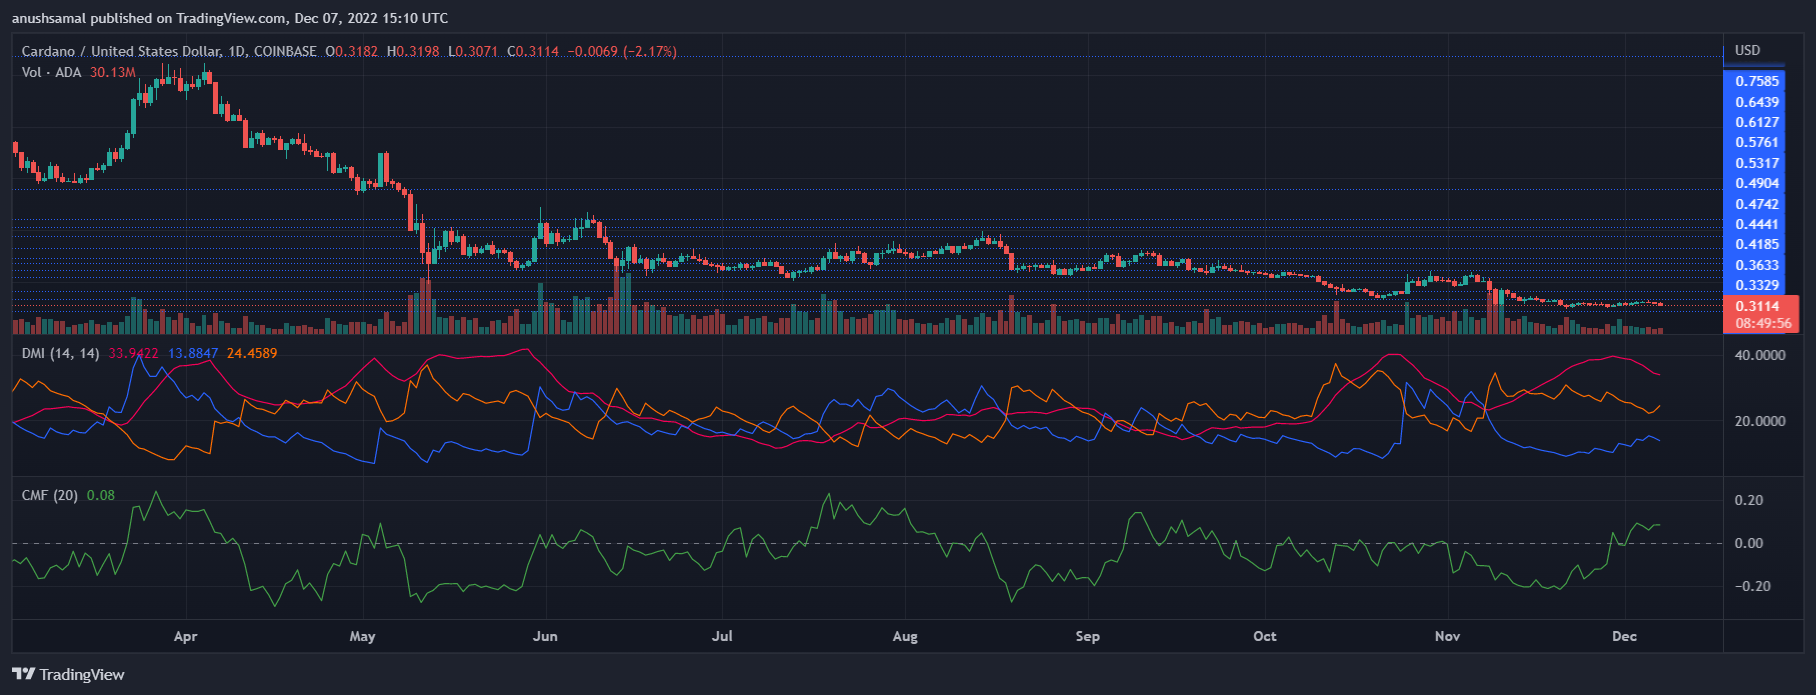
Even in a shorter time frame, the overall price momentum pointed toward negative price action. The Directional Movement Index, which depicts a trend’s price movement and strength, was bearish. The -DI (orange) line was above the +DI (blue) line.
The Average Directional Index was moving below the 40-mark; this could indicate that the altcoin’s present price momentum could depict a turnaround. The Chaikin Money Flow remained positive as the indicator was above the half-line, displaying that capital inflows still dominated outflows at press time.
Featured image from Unsplash, Chart: TradingView.com