TA: Bitcoin Reclaims 100 SMA, Here’s Why BTC Could Resume Uptrend
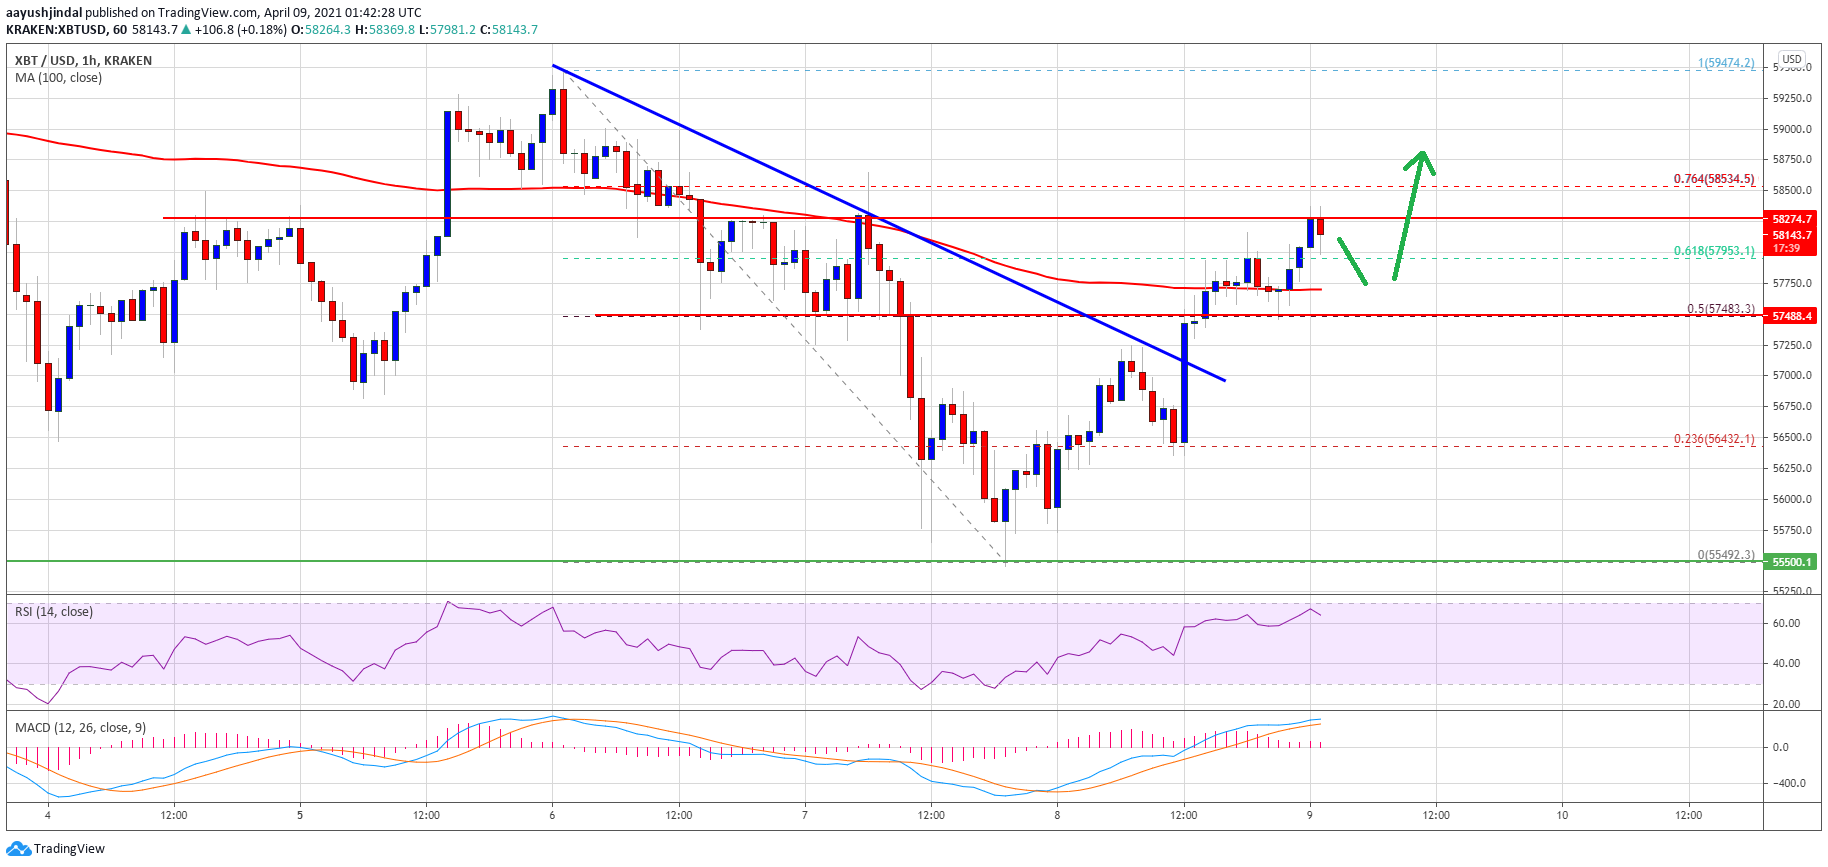
Bitcoin price started a fresh increase above the $57,500 resistance against the US Dollar. BTC is showing positive signs above $58,000 and the 100 hourly SMA.
- Bitcoin remained well bid above the $56,000 level and it started a fresh increase.
- The price is now trading above the $58,000 level and the 100 hourly simple moving average.
- There was a break above a key bearish trend line with resistance near $57,100 on the hourly chart of the BTC/USD pair (data feed from Kraken).
- The pair could correct lower, but the bulls are likely to remain active near $57,800 and $57,500.
Bitcoin Price Turns Green
Bitcoin traded as low as $55,492, where the bulls took a strong stand. As a result, BTC started a fresh increase above the $56,500 and $57,000 resistance levels.
The price even cleared the 50% Fib retracement level of the downward move from the $59,475 swing high to $55,492 low. There was also a break above a key bearish trend line with resistance near $57,100 on the hourly chart of the BTC/USD pair.
It is now trading above the $58,000 level and the 100 hourly simple moving average. An immediate resistance is near the $58,275 level. The 76.4% Fib retracement level of the downward move from the $59,475 swing high to $55,492 low is also near the $58,500 level.
Source: BTCUSD on TradingView.com
A clear break above the $57,275 and $58,500 resistance levels could open the doors for more gains. The next key resistance on the upside is near the $59,500 level. The main resistance is still near the $60,000 zone.
Dips Supported in BTC?
If bitcoin fails to climb above $58,275 and $58,500, there could be a short-term downside correction. An initial support on the downside is near the $57,750 level and the 100 hourly simple moving average.
The next major support is near the $57,500 level (the recent breakout zone). If the bulls fail to protect the 100 hourly SMA and then $57,500, there are chances of a steady decline. In the stated case, the price might decline towards the $56,500 level in the near term.
Technical indicators:
Hourly MACD – The MACD is now gaining momentum in the bullish zone.
Hourly RSI (Relative Strength Index) – The RSI for BTC/USD is now well above the 50 level.
Major Support Levels – $57,750, followed by $57,500.
Major Resistance Levels – $58,275, $58,500 and $59,500.