Charted: Binance Coin (BNB) Pumps Above $300, Why Bulls Could Aim New ATH
Binance coin price started a fresh rally above the $280 resistance against the USDT. BNB is now trading above $300 and it might continue to rise towards $350 or $400.
- Binance coin price started a fresh rally above the $260 and $280 resistance levels against the USDT.
- The price is now trading well above $280 and the 100 simple moving average (4-hours).
- There is a major bullish trend line forming with support near $290 on the 4-hours chart of the BNB/USDT pair (data source from Binance).
- The pair is likely to resume its upward move above the $315 and $320 resistance levels in the near term.
Binance Coin Price Breaks $300
After forming a base above $220, binance coin started a fresh increase. BNB broke the main $250 resistance and recently surpassed the $275 pivot level.
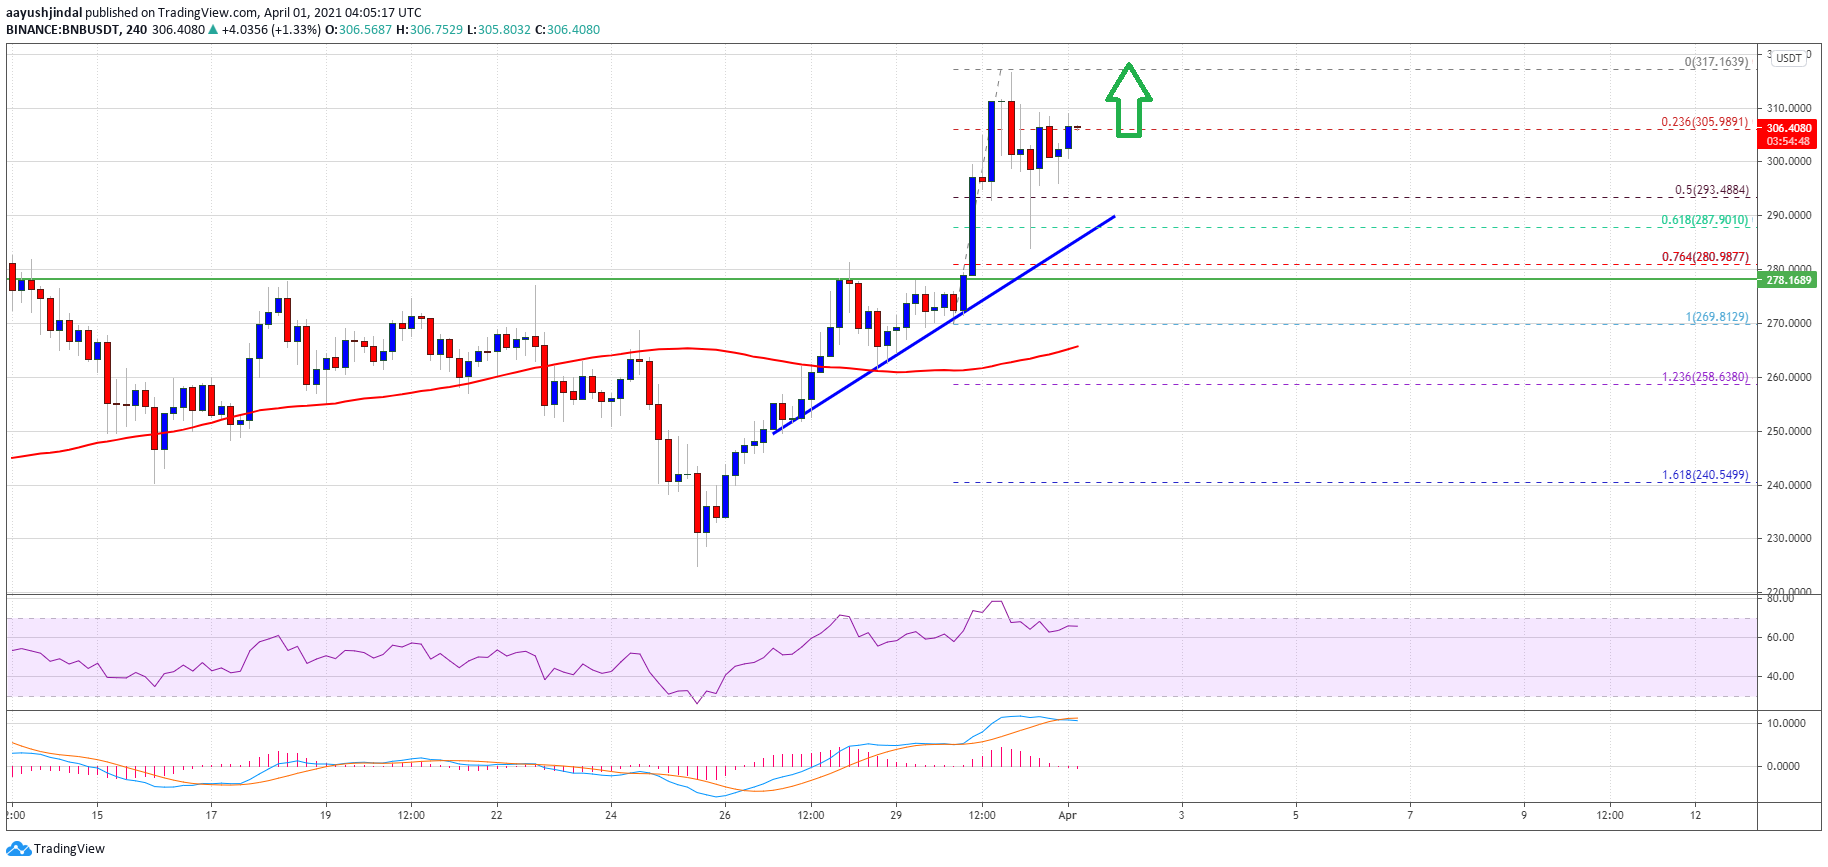
The bulls were able to lead the price above the $280 barrier and the 100 simple moving average (4-hours). As a result, there was a break above the $300 level. The price traded to a new monthly high at $317 and it is currently correcting gains.
It broke the $305 support level. There was also a break below the 23.6% Fib retracement level of the upward move from the $269 swing low to $317 high.
Source: BNBUSDT on TradingView.com
On the downside, the first major support is near the $290 level. It is close to the 50% Fib retracement level of the upward move from the $269 swing low to $317 high. There is also a major bullish trend line forming with support near $290 on the 4-hours chart of the BNB/USDT pair.
On the upside, the bulls are facing resistance near the $315 and $320 levels. The next major resistance is near the $340 level, above which the price is likely to set a new all-time high in the near term.
Dips Supported in BNB?
If BNB fails to continue higher above $315 and $320, there could be a fresh downside correction. The first major support is near the $295 level.
The next major support is near the $290 level and the trend line. If there is a downside break below the trend line support, there could be a drop towards the $280 support zone.
Technical Indicators
4-Hours MACD – The MACD for BNB/USDT is gaining pace in the bullish zone.
4-Hours RSI (Relative Strength Index) – The RSI for BNB/USDT is currently well above the 50 level.
Major Support Levels – $295, $290 and $280.
Major Resistance Levels – $315, $320 and $340.