Why Bitcoin Price Remains At Risk of Downside Break Below $57K
Bitcoin price is struggling to clear the $60,000 resistance against the US Dollar. BTC is likely to start a strong decline if there is a close below the $57,000 support.
- Bitcoin failed to clear the $60,000 level and started a fresh decline below $59,000.
- The price is still well above $55,000 and the 100 simple moving average (4-hours).
- There is a key rising channel forming with support near $57,200 on the 4-hours chart of the BTC/USD pair (data feed from Kraken).
- The pair could start a strong decline if there is a clear break below the $57,000 support zone.
Bitcoin Price is Correcting Gains
This past week, bitcoin price made an attempt to clear the $60,000 resistance against the US Dollar. However, the BTC/USD pair failed to settle above the $60,000 level and recently started a fresh decline.
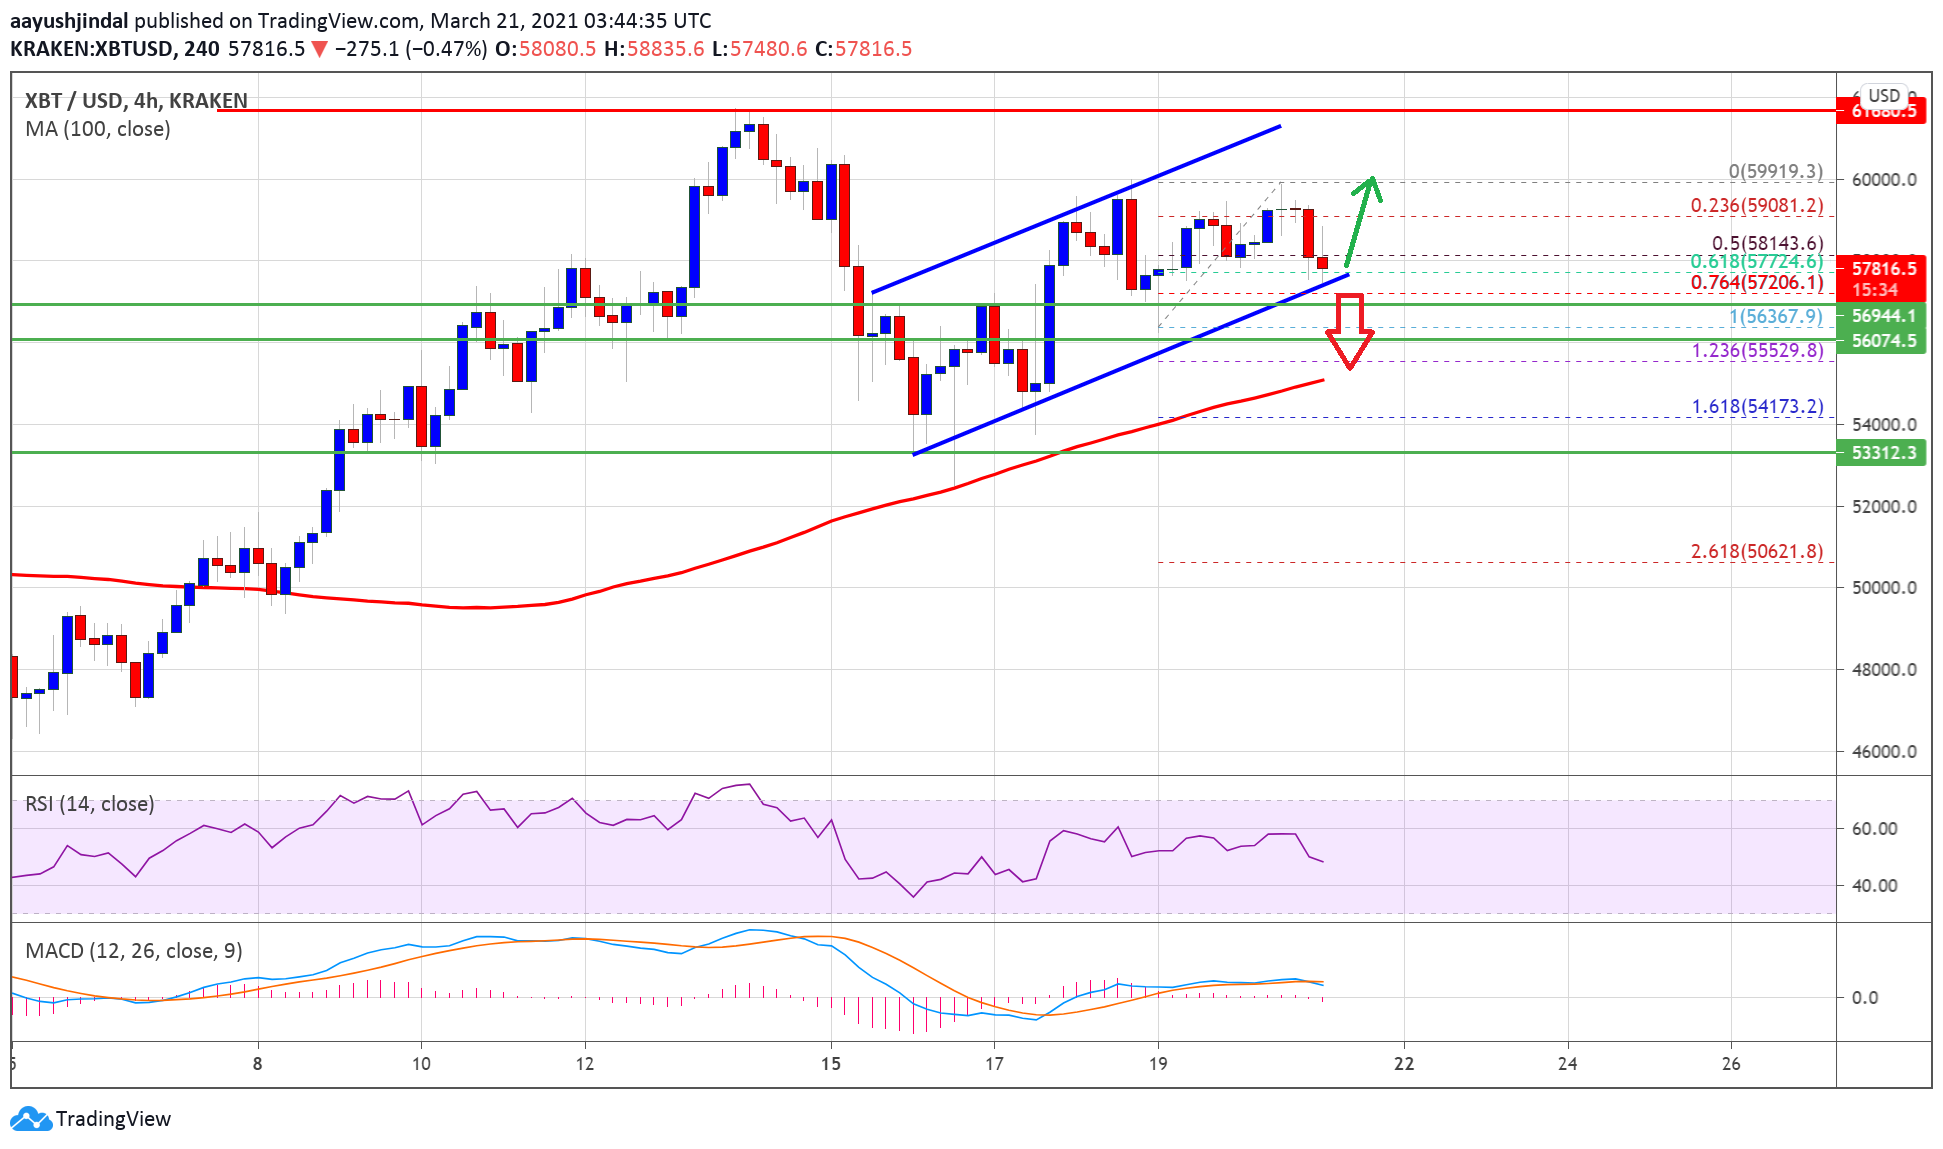
There was a break below the $59,200 and $58,500 support levels. The price even traded below the 50% Fib retracement level of the upward move from the $56,367 swing low to $59,919 swing high. The price is still well above $55,000 and the 100 simple moving average (4-hours).

Source: BTCUSD on TradingView.com
It is approaching the $57,200 and $57,000 support levels. There is also a key rising channel forming with support near $57,200 on the 4-hours chart of the BTC/USD pair.
The channel support is close to the 76.4% Fib retracement level of the upward move from the $56,367 swing low to $59,919 swing high. If there is a downside break below the channel support, the price could decline towards the $55,000 support level. Any more losses might call for a move towards the $53,200 support.
Fresh Increase in BTC?
If bitcoin remains stable above the $57,000 support level, there are chances of a fresh increase in the near term. An initial resistance on the upside is near the $59,200 level.
The main resistance is still near the $60,000 level. A clear break above the $60,000 zone might open the doors for a strong increase. In the stated case, the price could rise towards the $62,000 level and to a new all-time high.
Technical indicators
4 hours MACD – The MACD for BTC/USD is losing bullish momentum in the bullish zone.
4 hours RSI (Relative Strength Index) – The RSI for BTC/USD is struggling to stay above the 50 level.
Major Support Level – $57,000
Major Resistance Level – $60,000