This Bitcoin Metric Says The Bull Market Might Soon Be Over
Bitcoin price has retraced 10% from highs and is still reeling from the rejection from above $60,000. The pullback has caused two important long-term moving averages to come dangerously close to death-crossing, that when crossed in the past have signaled that the top is in for the bull market.
Here’s what data says about the coming end of the bull market, when it might happen, and how many days left approximately you’d have left to sell your coins at the highest profit if the signal is correct. If it is not, Bitcoin price could be on the cusp of an unprecedented uptrend unlike never before.
Picking The Bitcoin Bull Market Top Could Be As Easy As Pi
Bitcoin price has appreciated more than 1,500% from Black Thursday 2020 low to the highs set over this weekend above $60,000.
The leading cryptocurrency by market cap couldn’t sustain buying above the rounded number more than three times the former peak set in 2017, and has since come crashing back down by as much as 10% so far.
Related Reading | Bloody Monday: Bitcoin Selloff Saw Record $1.6B In Liquidations
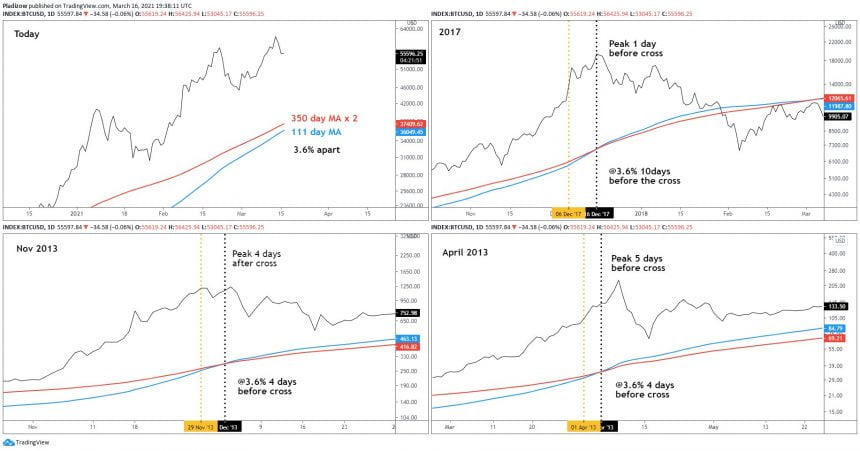
Debate has begun to if whether or not the top of the bull market is near, or potentially already in at this point. Adding fuel to these bearish takes, is the fact that the 111 day moving average is only 3.6% away from the “2X 350 day MA,” and in the past the metric has called “tops pretty well.”
According to one sharp-eyed crypto analyst who discovered the recurrence, when this behavior occurs on PositiveCrypto’s “Pi Cycle Top Indicator” it typically has appeared within four to ten days from the top of each bullish impulse.
PositiveCrypto's "Pi Cycle Top Indicator" has historically called past market tops | Source: BTCUSD on TradingView.com
In 2017, the peak of the bull run arrived just one day before the cross took place, with the metric reaching 3.6% distance just ten days before. Both times in 2013, 3.6% distance was achieved within a week from the top, and the top was within a week from the crossover one way or another.
The one anomaly was during 2011, when the cross arrived 40 days ahead of the peak. This time around, the two moving averages only just reached the critical 3.6% distance, but who knows what happens next.
Related Reading | Data Shows Bitcoin Peaks Last Roughly 40 Days: When To Sell Your Coins
Does that mean a peak is near? Or could the current bull market be so powerful, its is as if the cryptocurrency is reliving its early days of price discovery and the early 2011 anomaly is the more accurate direct comparison? Only time will tell.
If there is only limited time left in the current bull market, the same metric does also suggest that there could be yet another significant move higher before the peak is in.
Featured image from Deposit Photos, Charts from TradingView.com