Data Shows Bitcoin Peaks Last Roughly 40 Days: When To Sell Your Coins
Bitcoin price has been an uptrend for a year now, and given the strength of the move and the fact the asset is now at more than $50,000 per coin, begins to bring up the question: when to start selling your coins?
According to past crypto bull market data, the final push to the peak and remaining third of the bullish impulse, lasts for a period of only forty days before it is all over. But is it possible to know when this is happening or when it is about to end?
Velocity And Volatility At The Top Gets Fast And Furious
The cryptocurrency asset class is highly speculative in nature, but is beginning to become more fundamentally sound as adoption takes place and proof of concepts become working products.
However, thanks to Bitcoin’s block reward halving recurring every four years, thus far, crypto market cycles can be timed with some accuracy.
Related Reading | Bitcoin Could Close March With First Ever Quarterly Bear Signal
Following each halving, it is time to stop trading Bitcoin, and instead hold for the next phase of markup. Timing the top, however, isn’t so simple.
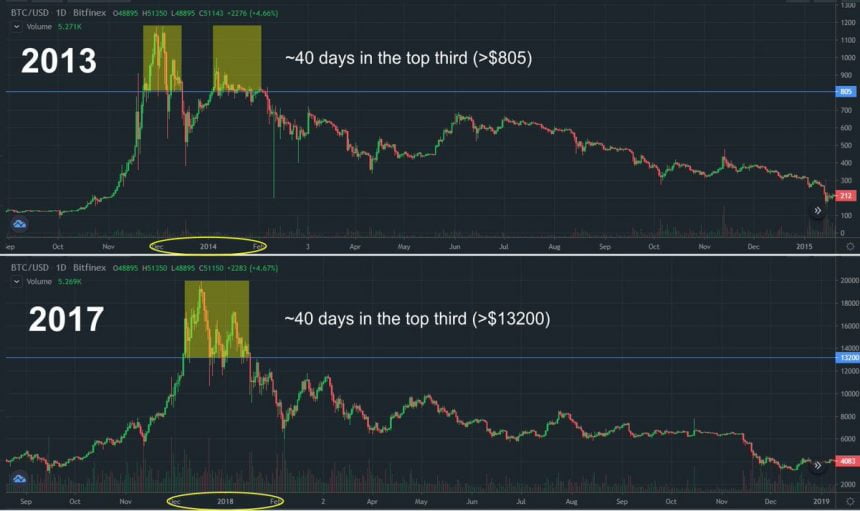
Each move when measured and divided into thirds, sees the fastest and most violent move in the final third. According to data, these periods and the final one-third stretch of the bull run, happen within a timeframe of only forty days and forty nights.

Both cycles the top cryptocurrency only spent forty days in the top third. | Source: BTCUSD on TradingView.com
Timing Bitcoin Peaks And Crypto Market Cycles: When To Sell Your Coins
Within those forty days, Bitcoin price completes its final parabolic push, and sees the first break of that advance that it cannot recover from.
Missing this final one third stretch, results in significant losses – as much as 50% off the asset’s peak almost immediately.
Data also says that assets that have gone parabolic, once broken, retrace 80% or more. Iconic commodities trader Peter Brandt accurately called for the cryptocurrency’s bottom range nearly a full year in advance using these reliable metrics.
During the last bull market, Bitcoin price dropped from $20,000 to only $3,000 – leaving many investors stuck holding for another cycle to cash out in profit.
Related Reading | Bitcoin “Cheat Sheet” Calls For Next Leg Up To $77K
The cycle before it, Bitcoin price also retraced 80% and it will do it again when this cycle has concluded. Regardless of this risk, investors still get in and try to get out at the right time.
Past cycle tops have almost always historically happened in November and December, which is has historically been a time when markets reach their cyclical peaks. It is not entirely clear why this is, but due to this being a widely known fact, any peaks could be front run during this bull run.
Other ways to potentially time the top, is to watch for the monthly RSI to reach highs from past bull cycles, and only then its playing a guessing game as to when the top is actually in.
Featured image from Deposit Photos, Charts from TradingView.com