TA: Bitcoin Gains Bullish Momentum, Why BTC Could Hit New ATH
Bitcoin price is showing positive signs above $55,000 against the US Dollar. BTC is likely to surpass $58,000 and trade to a new all-time high in the near term.
- Bitcoin climbed further above the $55,500 and $57,000 resistance levels.
- The price is now consolidating above $55,000 and it is well above the 100 hourly simple moving average.
- There is a major bullish trend line forming with support near $55,150 on the hourly chart of the BTC/USD pair (data feed from Kraken).
- The pair is likely to accelerate higher above $57,500 and $58,000 in the coming sessions.
Bitcoin Price is Showing Positive Signs
There was a steady rise in bitcoin above the $55,000 resistance zone. BTC climbed above the $56,000 level and it settled well above the 100 hourly simple moving average.
The bulls even pushed the price above the $57,000 resistance. A high is formed near $57,367 and the price is currently correcting lower. It traded below the 23.6% Fib retracement level of the upward move from the $53,002 low to $57,367 high.
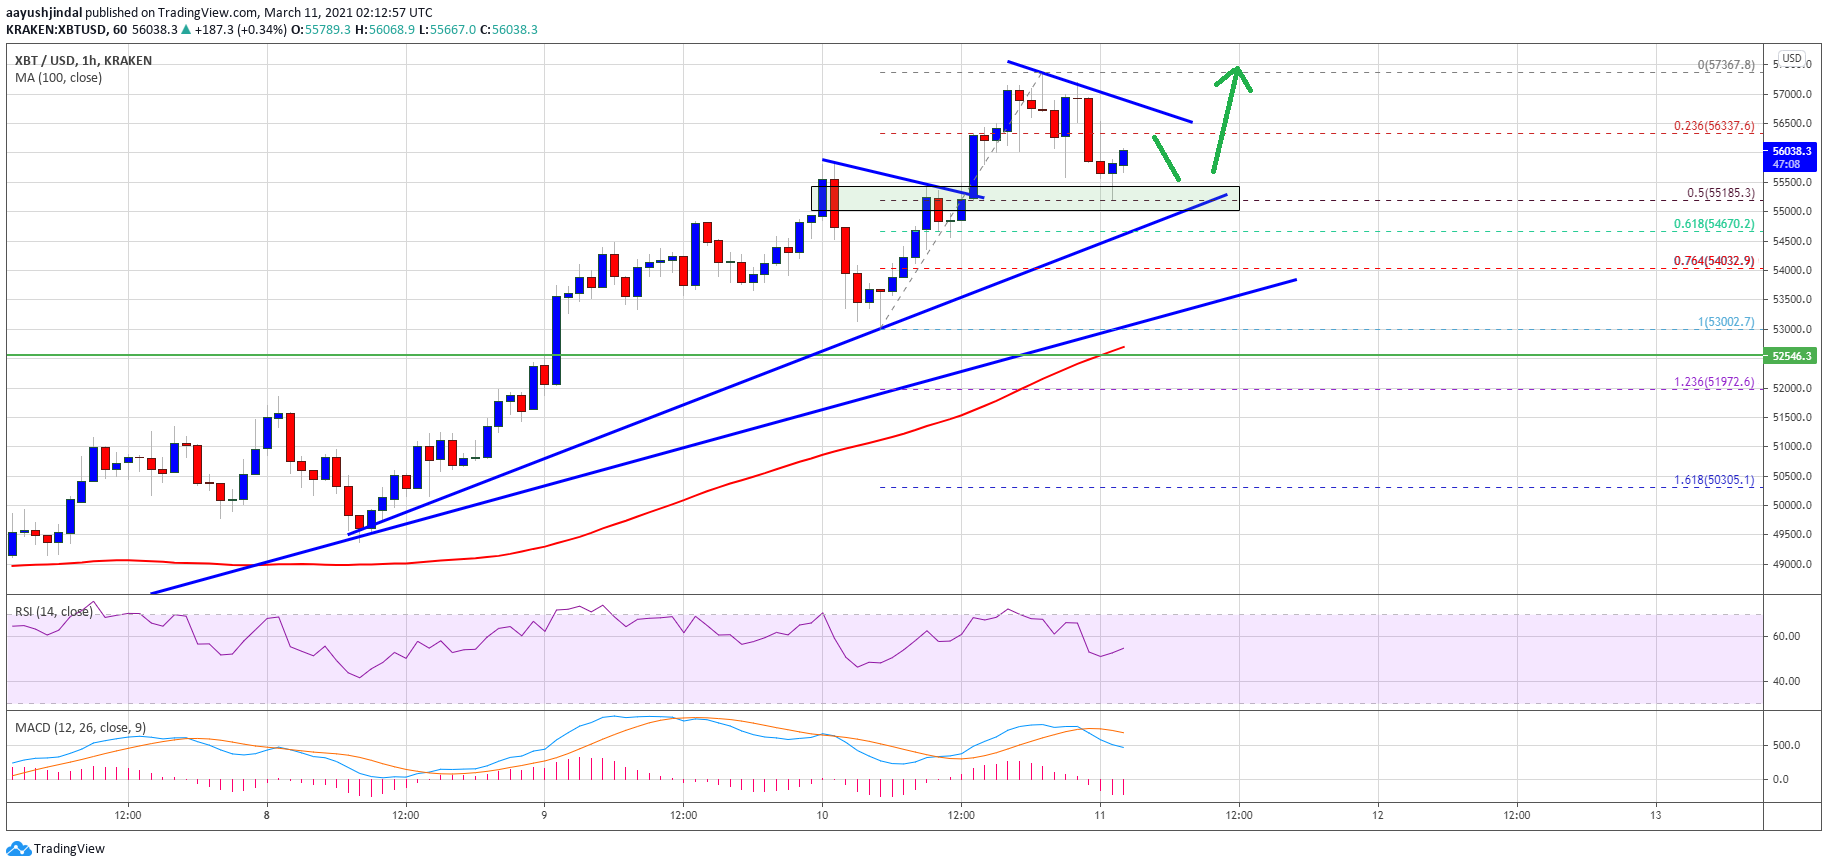
Bitcoin is testing the $55,500 support level and it is still well above the 100 hourly simple moving average. The next major support is near the $52,150 level. There is also a major bullish trend line forming with support near $55,150 on the hourly chart of the BTC/USD pair.
Source: BTCUSD on TradingView.com
The trend line is close to the 50% Fib retracement level of the upward move from the $53,002 low to $57,367 high. On the upside, the $56,500 level is a short-term hurdle. There is also a connecting bearish trend line at $56,500 on the same chart.
A clear break above the trend line resistance and $57,500 could open the doors for a move towards the $58,000 level. The next aim for the bulls could be a new all-time high or even $60,000.
Dips Supported in BTC?
If bitcoin fails to clear the $57,500 resistance, it could correct further lower. The first key support is near the trend line and $55,150.
If there is a downside break below the trend line support, there are chances of a move towards the $54,000 support. There is another trend line forming with support near $54,000 on the same chart.
Technical indicators:
Hourly MACD – The MACD is slowly losing momentum in the bearish zone.
Hourly RSI (Relative Strength Index) – The RSI for BTC/USD is still above the 50 level.
Major Support Levels – $55,150, followed by $54,000.
Major Resistance Levels – $57,500, $58,000 and $60,000.