TA: Bitcoin Holding Gains, Why BTC Could Surge Above $50K
Bitcoin price recovered above $48,000, but it failed near $50,000 against the US Dollar. BTC is now holding gains above $47,000 and it is likely to make another attempt to surpass $50,000.
- Bitcoin is consolidating gains above the $47,000 and $46,500 support levels.
- The price is now trading well above $47,000 and the 100 hourly simple moving average.
- There is a key declining channel or a bullish flag forming with resistance near $49,000 on the hourly chart of the BTC/USD pair (data feed from Kraken).
- The pair could start a strong increase once it clears $49,000 and $50,000 in the near term.
Bitcoin Price is Showing Positive Signs
After struggling to clear the $50,000 resistance, bitcoin started a downside correction. BTC declined below the $49,500 and $49,000 support levels.
The price even traded below the 23.6% Fib retracement level of the upward move from the $43,000 swing low to $50,190 high. It even declined below the $48,000 support level. However, the bulls were able to protect the $47,000 support zone.
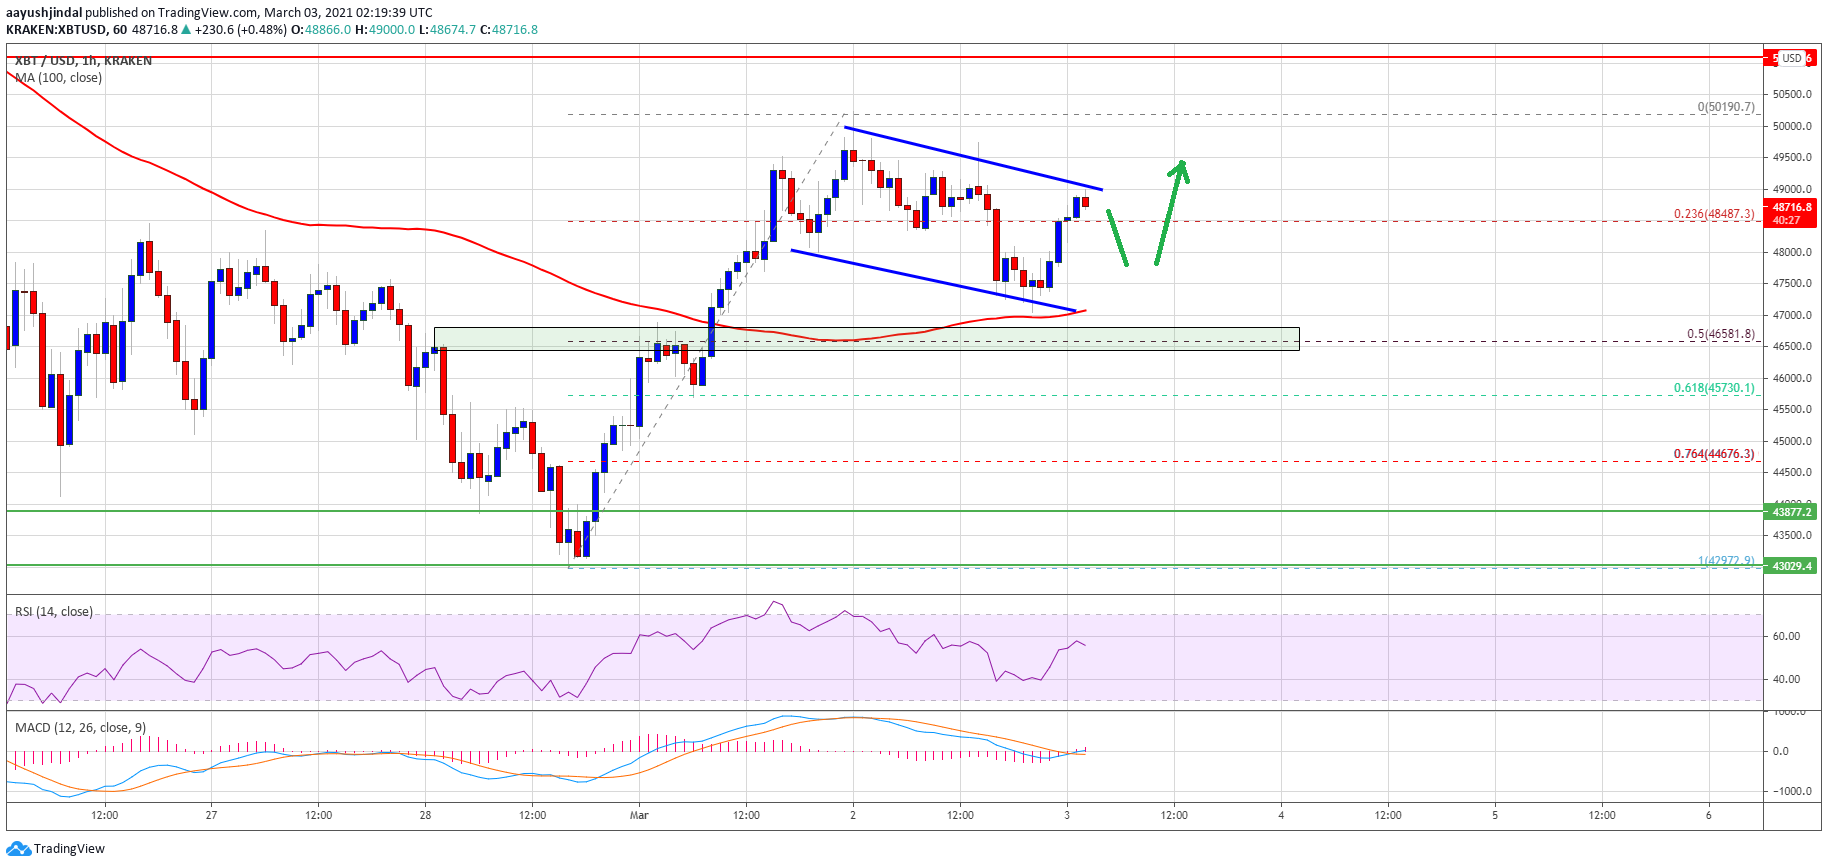
The price remained stable above the 100 hourly simple moving average, which is currently at $47,100. Bitcoin also remained well bid above the 50% Fib retracement level of the upward move from the $43,000 swing low to $50,190 high.

Source: BTCUSD on TradingView.com
It seems like there is a key declining channel or a bullish flag forming with resistance near $49,000 on the hourly chart of the BTC/USD pair.
If there is an upside break above the channel resistance, there are high chances of a push above the $50,000 resistance. The next major resistance is near $52,000, above which the bulls are likely to take control.
Fresh Dip in BTC?
If bitcoin fails to continue higher above the $49,000 and $50,000 resistance levels, there could be a fresh decline. The first key support on the downside is near the $47,500 level.
The next major support is near the $47,000 level and the 100 hourly simple moving average. The main breakdown zone is now forming near the $46,500 level, below which the price might dive to $43,000 in the near term.
Technical indicators:
Hourly MACD – The MACD is now gaining momentum in the bullish zone.
Hourly RSI (Relative Strength Index) – The RSI for BTC/USD is now well above the 50 level.
Major Support Levels – $47,000, followed by $46,500.
Major Resistance Levels – $49,000, $50,000 and $52,000.