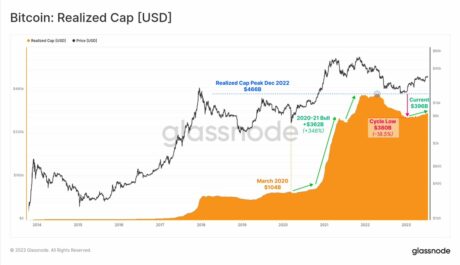
Category: Cryptocurrency News

Cryptocurrency News and Public Mining Pools

Bahamas regulator temporarily seizes FTX unit’s assets worth over $3.5 bln

submitted by /u/Feeling-Inside5147 [link] [comments]

What’s Next For Algorand Price As Coin Continues Downtrend?

The Algorand price has been downward for quite a few months now. The coin has fallen by 1.8% over the last 24 hours. The coin has lost over 4.7% of its market value in the past week. Algorand had been consolidating on its chart over the last few weeks, but the consistent lateral trading has pushed the bulls out of the market. The technical outlook has sided with the bears, with no clear indication of the price turning around in the coming trading sessions. Ever since ALGO lost the $0.28 price level, the coin has been unable to stop its downtrend. The aforementioned price floor acted as a crucial level for the altcoin. The Algorand price has also remained unaffected by positive changes in major market movers’ prices. Since the altcoin was rangebound for a while, buyers lost interest and rushed to sell the altcoin. Algorand has lost over 30% in the month of December itself. At the time of writing, the ALGO price is 96% below its all-time high from 2021. The market capitalization of Algorand has witnessed a considerable decline, indicating that sellers have completely taken over the market. Related Reading: Dogecoin Has To Remain Above These Levels For Price To Turn Around Algorand Price Analysis: One-Day Chart ALGO was auctioned for $0.166 at press time. The immediate resistance for the altcoin was at $0.172. The coin has attempted to test the overhead price ceiling, but the bearish strength has taken over the market. Since demand for Algorand has fallen substantially, the altcoin can fall to $0.163 before the price reverses itself. This could present traders with a shorting opportunity. Two crucial resistance levels were at $0.177 and then at $0.181. Moving above the $0.181 mark will help the coin target the $0.20 price. On the flip side, a fall from the present price level will bring the Algorand price to the $0.15 zone. The amount of ALGO traded in the last session was red, indicating a high selling volume at the time of writing. Technical Analysis The altcoin has depicted a death cross at the end of November, which is an extremely bearish signal. A death cross occurs when the long-term moving average moves above the short-term moving average. In the case of the Algorand price, the 50-Simple Moving Average (SMA) had crossed over the 20-SMA line. Ever since the death cross, ALGO has been under the grasp of sellers. The Relative Strength Index stood on the 30-line, a sign of the asset being oversold and undervalued. Similarly, the Algorand price was below the 20-SMA line as sellers continued to drive the price momentum in the market. Although all indicators pointed toward bearish strength, the Moving Average Convergence Divergence (MACD) indicator displayed green signal bars. MACD indicates price momentum and reversals; the green signal bar was tied to buy signals. This could mean buyers can re-enter the market now as ALGO could reverse its price. However, it is completely uncertain if ALGO will recover soon. The Parabolic SAR suggests the price direction. The indicator formed dotted lines above the candlesticks, which meant a continued downtrend for the asset. Related Reading: Dogecoin Breaking Past This Key Barrier Could Spell 10% Spike For DOGE Featured Image From Unsplash, Charts From TradingView.com

Daily General Discussion – December 30, 2022 (GMT+0)

Welcome to the Daily General Discussion thread. Please read the disclaimer and rules before participating.   Disclaimer: Consider all information posted here with several liberal heaps of salt, and always cross check any information you may read on this thread with known sources. Any trade information posted in this open thread may be highly misleading,…
Read more

The 10 largest crypto hacks and exploits in 2022 saw $2.1B stolen

Just the top 10 major cryptocurrency exploits garnered over $2 billion for malicious actors in a year that was marred with bankruptcies and collapses.

Are you married to an altcoin?

Have you developed such strong conviction for a particular altcoin that it is almost impossible for you to see past the self affirmation bias? Did you develop a strong connection based on engaging/developing in the ecosystem or simply based on price? If not, have you been able to cut your ties with coins before they…
Read more

While His Digital Trading Cards Tumble in Value, Trump Says His ‘Cute’ NFTs Were About the Art

After climbing to a high of 0.79 ether on Dec. 17, 2022, Donald Trump’s non-fungible tokens (NFTs) have dropped considerably in value over the last 12 days. On Dec. 29, 2022, Trump’s NFT collection has a floor value of 0.15 ether, which is around 81% lower than the floor value highs recorded last week. Trump […]

Bitcoin dominance at 42.24% – Highest since August 3rd as predicted by Benjamin Cowen

Benjamin Cowen of Into The Cryptoverse, insists that altcoins will continue to bleed against Bitcoin in 2023. He regularly says "you don't know what a cheap altcoin is if you joined crypto in the recent bull market". His advice has been to stay in cash and he's been advising this since the start of the…
Read more

Do you become numb and just stick to DCA?

Is the best advice for the common crypto folk, to just ignore any emotional reaction to the markets and continue to dollar cost average? I've been torn on the DCA part because so many people advise keeping max dry powder for the eventual drop lower. With the start of a new year on the horizon,…
Read more

Dogecoin Beats Bitcoin, Ethereum For Best Performance In Crypto Top 10

Dogecoin has once again emerged as one of the best performers for the year when it comes to the top 10 cryptocurrencies. The meme coin which enjoyed massive popularity in 2021 continues to hold on to gains even better than larger counterparts such as Bitcoin and Ethereum. Dogecoin Performs Exceptionally Well In a year where there were numerous implosions that tanked the crypto market further, dogecoin has come forward as a force to be reckoned with. It has held on to its value ahead of some of the largest cryptocurrencies in the space.  Related Reading: Prolonged Crypto Winter Pushes Kraken Exchange Out Of Japan Naturally, most cryptocurrencies have lost a significant chunk of their value but where dogecoin has lost only about 58% of its value in 2022, others such as bitcoin and ethereum have recorded yearly losses of 65% and 67%, respectively. This already puts the meme coin ahead of the two largest cryptocurrencies in the market. It also outperformed the likes of Cardano and Polygon, both of which are the ninth and tenth largest cryptocurrencies in the market. Cardano’s value is down more than 80% while Polygon has recorded declines of approximately 69% this year. DOGE holding above $0.07 | Source: DOGEUSD on TradingView.com The meme coin was only surpassed by Binance Coin (BNB) and XRP. Where BNB is down 53%, XRP is down 57%. This makes BNB the best performer out of the top 10, XRP is the second-best performer, and dogecoin is a close third. Other Metrics For Top 10 Cryptos Dogecoin has also done a good job in its rise from its cycle low. After touching $0.05 in June, it has managed to rise over 42% since then to be sitting at $0.07 at the time of this writing. However, it is still not the most accomplished in this regard. That title goes to XRP. Related Reading: Bitcoin Could See Another Bull Rally If This Happens XRP’s cycle low of $0.11 and its current price of $0.35 means that the digital asset is up almost 207% in the last 10 months. Another asset that saw triple-digit recoveries from the cycle low is Polygon which is up 142% from its June cycle low of $0.32. Others in the top 10 have not performed as well. Bitcoin is down around 6% from its cycle low of $17,664, and Cardano is seeing 38% losses from its cycle low of $0.4. Meanwhile, Ethereum and BNB are seeing much better headwinds with 33.65% and 32.41% increases, respectively. Nevertheless, this makes dogecoin the third-best performer once more using this metric. An impressive run for a meme coin mainly driven by hype. Featured image from Coinbase, chart from TradingView.com

Bitcoin Now Under Realized Price For 163 Days, Here’s How This Compares Historically

On-chain data shows Bitcoin has now been below its realized price for 163 days in this bear market; here’s how this compares with previous cycles. Bitcoin Realized Price Is Currently Valued At Around $19,900 According to CryptoQuant’s year-end dashboard release, the bear market would be over if BTC reclaims this level. To understand what the “realized price” is, the “realized cap” must be looked at first. The realized cap is a capitalization model for Bitcoin that aims to provide a sort of “real value” for the crypto. Unlike the usual market cap, which simply values each coin in circulation using the current BTC price, the realized cap prices each token at the same price it was last moved. For example, if 1 BTC was bought at $20,000, but the price has now changed to $16,000, the market cap will consider it valued at $16,000. The realized cap, however, will say its true value is $20,000. Now, if the total realized cap of Bitcoin is divided by the total number of coins in circulation, a “realized price” is obtained. This price signifies the cost-basis of the average coin in the market (that is, the price at which investors acquired the average coin at). Here is a chart that shows the trend in the BTC realized price over the entire history of the asset: The BTC price seems to have been below this metric in recent months | Source: CryptoQuant As the above graph displays, the normal price of Bitcoin has been below the realized price for a while now. Historically, BTC has spent very little time in this region, as only the worst phases of a bear market usually pull the coin below the level. From the chart, it’s apparent that In the 2011-2012 bear market, BTC spent 158 days under the realized price. Then, in 2014-2015, the coin spent a whopping 276 days in this zone. Related Reading: Bitcoin Interexchange Flow Pulse About To Reverse, What Does It Mean? The 2018-2019 bear saw the shortest amount of time in the region, as the price took 134 days to pull itself above the level. Finally, Bitcoin has been trapped under the realized price for 163 days in the current cycle. This means that BTC has spent more time in this region in the current bear market than in any other before, except for 2014-2015. If the current bear is comparable to 2014-2015, then it would mean there is still more than 100 days to go before Bitcoin can exit the zone. Related Reading: Litecoin Bullish Signal: Shark And Whale Addresses Hit 2-Year High Either way, CryptoQuant expects the crypto to reclaim this level somewhere in 2023, and it will be then that this bear may be considered to be over. BTC Price At the time of writing, Bitcoin’s price floats around $16,600, down 1% in the last week. BTC has declined in the last two days | Source: BTCUSD on TradingView Featured image from Kanchanara on Unsplash.com, charts from TradingView.com, CryptoQuant.com