Category: Cryptocurrency News

Cryptocurrency News and Public Mining Pools

What happens if the Black Rock ETF gets rejected?

Everyone can remember how good sentiment was when the announcement was first made. Then the SEC rejected the initial application, although it turned out they only asked them to refile the application and change some small details. Despite this there was a big dump down to 26,000, BlackRock’s SEC ETF Approval Record is 575 to…
Read more

XRP Maintains Bullish Run With Nearly 80% Rally – Is $1 Within Reach?

XRP has undergone a remarkable price upsurge, surging to more than $0.80 and witnessing an impressive 77% increase over the past seven days in trading activity. This surge was predominantly triggered by Ripple’s partial victory against the United States Securities and Exchange Commission. In the court ruling, a judge acknowledged that Ripple’s institutional sales could be considered securities. However, it’s important to note that not all other sales were classified similarly. This ruling is widely perceived as a significant victory for Ripple Labs and its digital token. Related Reading: XRP Flexes Muscles: Ripple Token Unfazed By Crypto Turmoil With 68% Rally Currently, XRP is edging closer to a crucial resistance level at $0.85, signaling a solid buying pressure prevailing in the market. This optimistic trend bodes well for Ripple’s medium-term prospects, suggesting favorable times for the digital token. XRP Price Surge And Market Cap Inflow Post-Ripple Vs. SEC Data from crypto market tracker CoinMarketCap shows that XRP is trading at $0.8368, with an impressive 5% increase observed within the last 24 hours. Over the past seven days, the crypto has experienced a substantial surge of a little over 77%.  XRP flashing green in all timeframes. Source: CoinMarketCap This remarkable growth has coincided with an inflow of more than $16 billion to XRP’s market capitalization. Notably, the market cap has risen from $25 billion on July 12 to its current value of $44 billion, with a significant portion of this increase occurring shortly after the outcome of the Ripple-SEC court case. Related Reading: BNB Chain Unveils Beacon Update – What’s Its Bearing On Price? Despite the remarkable surge, XRP faces a formidable resistance zone at $0.85. This region is characterized by high selling pressure and increased supply, making it challenging for the digital currency to breach this level. Nevertheless, the market sentiment among traders remains bullish, which enhances the probability of XRP breaking through the resistance region. XRP market cap currently at $44 billion. Chart: TradingView.com XRP To Break $1 Threshold? It is essential to exercise caution and consider historical patterns when analyzing price movements. Typically, after significant upward trends, crypto assets tend to undergo a consolidation or correction phase, and XRP is no exception. Therefore, it is likely that the price will enter a short-term correction phase, accompanied by higher volatility and pullback periods, before the next notable upward movement occurs. XRP seven-day price action. Source: CoinMarketCap Considering the bullish momentum fueled by the positive outcome in the SEC lawsuit, XRP has a promising opportunity to surpass the highly anticipated $1 price threshold.  The favorable court ruling and the subsequent surge in price and market capitalization have significantly boosted confidence among investors and traders. If this momentum continues, it could lead to further gains for XRP in the coming days or weeks. (This site’s content should not be construed as investment advice. Investing involves risk. When you invest, your capital is subject to risk). Featured image from Visit Idaho

SEC Chairman Gary Gensler Requests $2.4B Budget To Tackle Misconduct in Crypto Markets

If this get approved, do you think there'll be more regulations or is he gonna come after everything we own. submitted by /u/-_-DarthVader [link] [comments]

Does anyone here actually work in the crypto/blockchain industry?

I’ve had this question in my mind for a while but have never posted it. I’m just wondering how many members of this subreddit actually work in the industry in some capacity. It would be interesting to hear what kind of positions people hold, how long they’ve had it and where they see their career…
Read more

China’s digital yuan nears $250B transaction volume: Central bank governor

While the adoption and use cases of China’s e-CNY are expanding, the digital yuan still only represents 0.16% of China’s monetary supply.

ADA Price Hold Strong At $0.30: Indicators Suggest Fresh Rally To $0.38

Cardano’s price is holding the key support at $0.30. ADA could start a steady increase if there is a clear move above the $0.340 resistance. ADA price is showing positive signs above the $0.30 level against the US dollar. The price is trading above $0.300 and the 100 simple moving average (4 hours). There is a major bullish trend line forming with support near $0.295 on the 4-hour chart of the ADA/USD pair (data source from Kraken). The pair could gain bullish momentum if there is a close above the $0.340 resistance. Cardano’s ADA Price Signals Fresh Increase This past week, Cardano’s price started a downside correction from the $0.379 high. The price traded below the $0.365 and $0.340 support levels to move into a short-term bearish zone, similar to Bitcoin and Ethereum. However, the bulls were active above the $0.30 level. A low is formed near $0.3001 and the price is now rising. There was a break above the $0.320 resistance. The price climbed above the 23.6% Fib retracement level of the downward move from the $0.379 swing high to the $0.300 low. ADA price is now trading above $0.300 and the 100 simple moving average (4 hours). There is also a major bullish trend line forming with support near $0.295 on the 4-hour chart of the ADA/USD pair. On the upside, immediate resistance is near the $0.340 zone. It is close to the 50% Fib retracement level of the downward move from the $0.379 swing high to the $0.300 low. Source: ADAUSD on TradingView.com The first major resistance is forming near the $0.350 zone. The next key resistance might be $0.365. If there is a close above the $0.365 resistance, the price could start a decent increase. In the stated case, the price could rise toward the $0.380 resistance zone. Are Dips Limited in ADA? If Cardano’s price fails to climb above the $0.340 resistance level, it could start another decline. Immediate support on the downside is near the $0.315 level. The next major support is near the $0.30 level and the trend line. A downside break below the $0.30 level could open the doors for a sharp fresh decline toward $0.275. The next major support is near the $0.262 level. Technical Indicators 4 hours MACD – The MACD for ADA/USD is gaining momentum in the bullish zone. 4 hours RSI (Relative Strength Index) – The RSI for ADA/USD is now above the 50 level. Major Support Levels – $0.315, $0.300, and $0.275. Major Resistance Levels – $0.340, $0.350, and $0.365.

Ethereum Price Could Narrowly Avoid More Losses if it Closes Above One Key Level

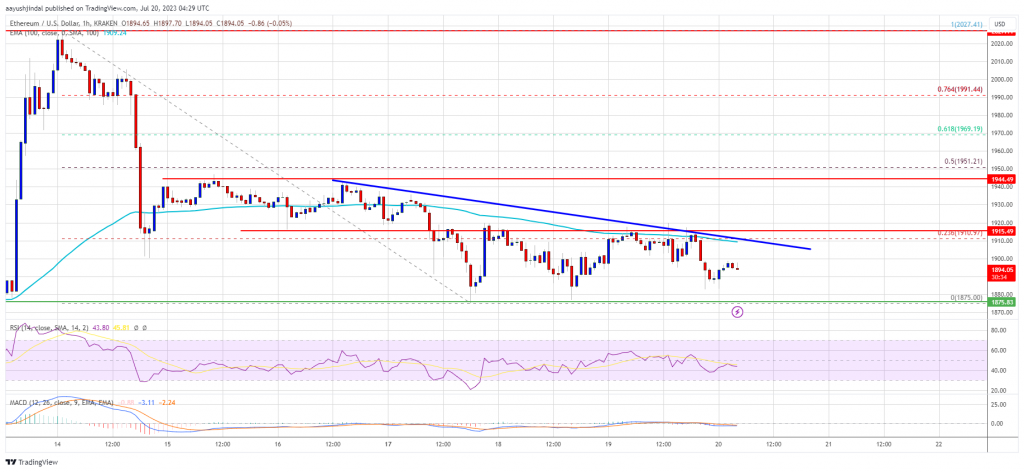
Ethereum price is trading above the $1,875 support zone against the US Dollar. ETH could start a decent increase if it clears the $1,915 resistance zone. Ethereum is consolidating above the $1,875 level. The price is trading below $1,920 and the 100-hourly Simple Moving Average. There is a major bearish trend line forming with resistance near $1,910 on the hourly chart of ETH/USD (data feed via Kraken). The pair could start a steady increase if it clears the $1,915 and $1,940 resistance levels. Ethereum Price Holds Support Ethereum’s price remained stable above the $1,875 support zone. ETH bulls seem to be active above the $1,875 level and protecting more losses, similar to Bitcoin. The price was able to recover a few points above the $1,890 level. However, the bears are active near the $1,900 pivot level. There is also a major bearish trend line forming with resistance near $1,910 on the hourly chart of ETH/USD. Ether is now trading below $1,920 and the 100-hourly Simple Moving Average. On the upside, immediate resistance is near the $1,910 level and the trend line. It is close to the 23.6% Fib retracement level downward move from the $2,027 swing high to the $1,875 low. The first major resistance is near the $1,945 level or the 50% Fib retracement level downward move from the $2,027 swing high to the $1,875 low, above which the price could start a steady increase. Source: ETHUSD on TradingView.com The next major resistance is near the $2,030 level. Any more gains could send Ether toward the $2,120 resistance in the near term. More Losses in ETH? If Ethereum fails to clear the $1,915 resistance, it could start a fresh decline. Initial support on the downside is near the $1,885 level. The first major support is near the $1,875 level, below which the price accelerate lower. The next major support is near the $1,825 support level. If the bulls fail to protect the $1,825 support, there could be a drop to $1,770. Any more losses could open the doors for a move toward the $1,720 support level in the near term. Technical Indicators Hourly MACD – The MACD for ETH/USD is losing momentum in the bullish zone. Hourly RSI – The RSI for ETH/USD is now below the 50 level. Major Support Level – $1,875 Major Resistance Level – $1,915

ChatGPT’s capabilities are getting worse with age, new study claims

Some of ChatGPT’s responses have shown the model’s accuracy deteriorated over the last few months and researchers can’t figure out why.