Category: Cryptocurrency News

Cryptocurrency News and Public Mining Pools

Shiba Inu At $0.0000072: Sellers Push For Breakout From Compact Zone

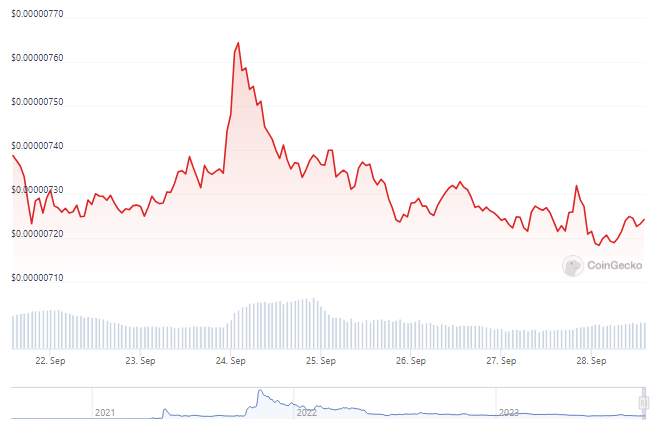
Shiba Inu (SHIB) has been navigating turbulent waters in the crypto market since mid-April. With its price oscillating between the lows of $0.0000068 and the highs of $0.0000076, SHIB holders have been eagerly awaiting a breakout from this sideways movement. The question on everyone’s mind: Will sellers succeed in pushing SHIB out of its current zone? Price analysis shows that since mid-August, SHIB has been grappling with a bearish market structure on both higher and lower timeframes. The ominous signs began with a sharp price rejection at the $0.00001 price zone, triggering a cascade of sell-offs that brought the price crashing below the once-strong support at $0.0000080. Related Reading: Solana Bulls Struggle To Break $21 Barrier – What Lies Ahead? The Relative Strength Index (RSI) has consistently remained below the neutral 50 mark, underscoring the relentless selling pressure. Furthermore, the Chaikin Money Flow (CMF) plummeted from positive to negative during this prolonged range-bound period. Current SHIB Stats  As of the latest data available on CoinGecko, SHIB is trading at approximately $0.000007258220, showing a minor 0.2% decline in the past 24 hours and a seven-day dip of 3.1%. These figures indicate the prevailing bearish sentiment surrounding SHIB. SHIB market cap reaches $4.2 billion. Chart: TradingView.com The $0.0000080 level, which had previously acted as a stronghold for bulls, has now transformed into a formidable resistance barrier due to the sustained selling pressure. While SHIB has maintained a sideways trajectory since this resistance flip, the looming threat of further bearish activity cannot be ignored.  A successful bearish breakout could potentially lead SHIB to target the June low of $0.000006, the analysis notes. Conversely, if Bitcoin (BTC) stages a rally beyond $27,000, it might just be the catalyst for an unexpected bullish surge in SHIB’s current range. SHIB Bulls Hold On To Optimism On a more optimistic note, some analysts believe that if SHIB manages to hold support at $0.0000070, in conjunction with an ascending trendline, it could pave the way for a sentiment shift and potential price recovery, aiming for levels beyond $0.00001. The first crucial step towards this ascent is conquering the immediate seller congestion at $0.0000074. Source: Coingecko Related Reading: LINKing The Dots: Why Chainlink Could Be The Altcoin To Watch, Top Trader Says Shiba Inu (SHIB) remains firmly entrenched in a bearish market structure, with several indicators pointing to sustained selling pressure. However, the crypto world is known for its unpredictability, and market sentiment can shift rapidly.  Traders and enthusiasts alike will be closely monitoring these critical levels, hoping for a change in SHIB’s fortune, but with caution as they navigate the treacherous crypto waters. (This site’s content should not be construed as investment advice. Investing involves risk. When you invest, your capital is subject to risk). Featured image from iStock

Binance urges users to convert euros to USDT after Paysafe debank

Binance’s European debanking woes continue as it urges Paysafe users to convert their euros to digital dollars.

5 lowlights of Gary Gensler's evasive testimony before Congress

The United States Securities and Exchange Commission chief was asked whether the purchase of Pokemon trading cards is a security transaction and whether Bitcoin is a commodity.

Binance asks users to convert EUR to USDT after Paysafe goes AWOL

submitted by /u/Ispan [link] [comments]

Uptober is about to Begin! A look at Bitcoin’s performance over the last 10 Octobers.

Uptober is just about to begin! Now, some of may have heard the little name for October within the Crypto space and there's a good reason for it. Using the data from Coingecko, over the past 10 years of data, BTC has gone up in price across the duration of October 8 times out of…
Read more

Ethereum Price Faces Rejection But Bulls Are Not Out of Woods Yet

Ethereum price is attempting a fresh increase above $1,620 against the US Dollar. ETH must settle above $1,620 and $1,650 to start a decent increase. Ethereum is attempting a recovery wave above the $1,600 level. The price is trading above $1,600 and the 100-hourly Simple Moving Average. There is a key bullish trend line forming with support near $1,600 on the hourly chart of ETH/USD (data feed via Kraken). The pair could start a decent increase if there is a close above $1,620 and $1,650. Ethereum Price Holds Ground Ethereum’s price remained well-supported above the $1,580 level. ETH formed a base above $1,600 and recently moved a few points higher, like Bitcoin. There was a move above the $1,620 level but upsides were limited. A high was formed near $1,633 before there was a strong bearish reaction. The price trimmed most gains and revisited the $1,580 zone. A low is formed near $1,583 and the price is now rising. Ethereum is trading above $1,600 and the 100-hourly Simple Moving Average. There is also a key bullish trend line forming with support near $1,600 on the hourly chart of ETH/USD. On the upside, the price might face resistance near the $1,608 level or the 50% Fib retracement level of the recent decline from the $1,633 swing high to the $1,583 low. The next major resistance is $1,620. It is close to the 76.4% Fib retracement level of the recent decline from the $1,633 swing high to the $1,583 low. Source: ETHUSD on TradingView.com A push above $1,620 might send Ether further higher in the coming sessions. The main hurdle is still near the $1,650 and $1,660 levels. If the bulls succeed in clearing the $1,660 hurdle, the price could start a decent increase toward the $1,720 resistance. Any more gains might open the doors for a move toward $1,800. Another Drop in ETH? If Ethereum fails to clear the $1,620 resistance, it could start another decline. Initial support on the downside is near the $1,600 level and the trend line. The next key support is $1,580, below which the price could test the $1,540 support. A downside break below the $1,540 support might spark strong bearish moves. In the stated case, there could be a drop toward the $1,450 level. Technical Indicators Hourly MACD – The MACD for ETH/USD is losing momentum in the bearish zone. Hourly RSI – The RSI for ETH/USD is now above the 50 level. Major Support Level – $1,580 Major Resistance Level – $1,620

Mark Zuckerberg reveals Meta AI chatbot, his answer to ChatGPT

The new AI assistant, Meta AI will be initially available from Sept. 27 for a limited group of U.S.-based users.

Bitcoin Bulls Keep Pushing But Faces Rejection, 100 SMA Is The Key

Bitcoin price attempted a fresh increase above the $26,500 resistance. However, BTC failed to settle above $26,700 and reacted to the downside. Bitcoin is still struggling to clear $26,500 and $26,700. The price is trading above $26,200 and the 100 hourly Simple moving average. There is a connecting bullish trend line forming with support near $26,200 on the hourly chart of the BTC/USD pair (data feed from Kraken). The pair could again climb higher unless there is a close below $26,200 and $26,000. Bitcoin Price Faces Uphill Task Bitcoin price started a decent recovery wave from the $26,000 support zone. BTC climbed higher above the $26,350 and $26,500 resistance levels. The price even spiked above the $26,700 resistance. However, the bears defended more gains. A high was formed near $26,818 and there was a strong rejection pattern. The price trimmed all gains and declined below the $26,500 level. It even dived below $26,200. A low is formed near $26,100 and the price is now attempting a fresh increase. Bitcoin is trading above $26,200 and the 100 hourly Simple moving average. There is also a connecting bullish trend line forming with support near $26,200 on the hourly chart of the BTC/USD pair. Immediate resistance on the upside is near the $26,450 level. It is close to the 50% Fib retracement level of the downward move from the $26,818 swing high to the $26,100 low. Source: BTCUSD on TradingView.com The next key resistance could be near the $26,650 level or the 76.4% Fib retracement level of the downward move from the $26,818 swing high to the $26,100 low. To start a recovery wave, the price must settle above $26,650. In the stated case, the price could climb toward the $27,000 resistance. Any more gains might call for a move toward the $27,500 level. Another Decline In BTC? If Bitcoin fails to start a fresh increase above the $26,450 resistance, it could start another decline. Immediate support on the downside is near the $26,200 level and the trend line. The next major support is near the $26,000 level. A downside break and close below the $26,000 level might start another major decline. The next support sits at $25,400. Any more losses might call for a test of $25,000. Technical indicators: Hourly MACD – The MACD is now losing pace in the bearish zone. Hourly RSI (Relative Strength Index) – The RSI for BTC/USD is now above the 50 level. Major Support Levels – $26,200, followed by $26,000. Major Resistance Levels – $26,450, $26,650, and $27,000.

Funny Indian guy video

There was a video floating around during the bull run of a guy who's second language was English, pretty sure it was an Indian guy, I think in a river, saying some classic newbie crypto stuff like "please make it go back up, I've spent my life savings, now it's down but I need it…
Read more