
FTX’s former law firm hit with lawsuit alleging it set up shadowy entities
The suit claims “shadowy entities” set up by Fenwick & West were allegedly used by FTX and former top executives to misappropriate customer funds.
The suit claims “shadowy entities” set up by Fenwick & West were allegedly used by FTX and former top executives to misappropriate customer funds.
In a new development, a trader who placed a substantial $10 million bet against LUNA in May 2022 before the then native currency and UST—the algorithmic stablecoin, collapsed is now setting his sight on Reddit Moons. Going by the moniker “GCR,” on-chain data on August 8 showed the trader moved 450,000 MOON from MEXC Exchange to Kraken. Moons Rallying Moons, the ERC-20 token associated with the r/CryptoCurrency forum on Reddit, is firm and on an uptrend, looking at current price action. At spot rates, the token is up 400% from late July and changing hands at $0.47, hovering near 2023 highs. Related Reading: HBAR Token Scores Impressive Gains As Major Cryptos Nosedive Based on price action from MEXC trade data, the immediate resistance level is at $0.65, which was printed in late July 2023. However, with the revival currently visible across the crypto market, prices will likely continue increasing. To illustrate, Moons is already up 90% in August alone, rebounding from $0.25 and surging to spot rates. Several factors are believed to be fanning demand. One of these is the influence of traders like GCR, who are acquiring Moons and potentially improving sentiment on altcoins considering the recent lower lows recorded in the better part of July. However, looking at how MOON prices reacted after Kraken’s listing on August 7, the community appears more buoyant and confident of improving liquidity. Kraken Listing As trackers reveal, before the Kraken listing, most Moons trading activity was concentrated on MEXC Exchange. On August 7, Kraken announced its listing of Moons alongside Bricks (BRICK). Alongside the announcement, Kraken said users could deposit MOON and BRICK from the Arbitrum Nova network. Moons and Bricks are also available for trading on Kraken and Kraken Pro accounts. From Kraken Pro, clients can trade MOON and BRICK perpetual derivatives. MOON has been described as a “community-driven” token since its launch in May 2020. Within the r/CryptoCurrency subreddit, it serves multiple functions, including rewarding users who contribute positively. Reddit said Moons’ holders can access premium features, including badges and custom emojis, and tip fellow community members. Moreover, holding Moons grants voting power in subreddit polls, affording holders a say in shaping the subreddit’s future. Related Reading: Litecoin Long-Term Holders Smartly Exited Before Halving, Data Shows Arbitrum data on August 8 shows over 121 million Moons in circulation. Out of this, more than 206,000 holders have generated over 670,000 transfers. All Moons are stored on Vault, the mobile-based wallet launched in 2022. Feature image from Canva, chart from TradingView
PAXG – Paxos Gold What is it? Tokenized version of Gold on the Ethereum Blockchain. Makes it easy to hold, trade and lend gold without the burden of moving, securing and holding the physical asset. Why should it exist? Access to investment grade gold is reserved for a very few with access to purchase and…
Read more

The MuesliSwap team wants to refund users that have lost funds to high slippage due to the way the DEX’s matchmaker was set up.
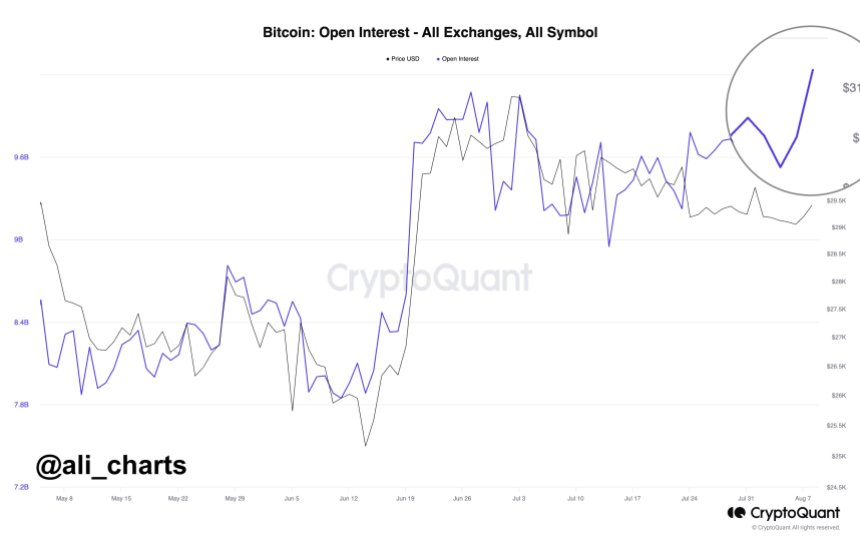
The cryptocurrency market has experienced a period of stagnation, with Bitcoin (BTC) trading within a narrow range for the past week. However, according to market analyst Ali Martinez, there is a glimmer of hope on the horizon as Open Interest, a key indicator of market sentiment, has skyrocketed to a year-to-date high. Correlation Between Open Interest And Bitcoin Notably, the correlation between Open Interest and Bitcoin’s price has historically been significant, suggesting that this surge may herald a potential reversal in the leading cryptocurrency’s fortunes. Martinez believes the recent dip to $28,700 prompted crypto traders to take long positions, fueling optimism for a Bitcoin resurgence. Over the past week, the overall crypto market has experienced a period of stagnation, with Bitcoin trading within a tight range of $28,900 to $29,200. This consolidation follows a continuous decline from its yearly high of $31,800, which has also set the tone for other major cryptocurrencies. The lack of significant price movement has left investors and traders eager for a catalyst that could propel the market forward. Related Reading: Is Curve DAO (CRV) Price On Track To Reach Or Exceed $1 This Month? Nevertheless, the number of open long and short positions on crypto derivative exchanges has surged to a remarkable year-to-date high of $10.086 billion. This surge in Open Interest is significant, indicating heightened market activity and trader engagement. One crucial aspect to consider is the historical correlation between Open Interest and the price of Bitcoin. This relationship has often been strong, with Open Interest as a leading indicator for potential price movements. As Open Interest reaches new highs, it suggests that market participants are actively taking positions in anticipation of a significant market shift. While the crypto market has been characterized by stagnation and decline in recent times, the surge in Open Interest to a yearly high provides hope for a bullish reversal. Bearish Divergence Signals Potential Pullback For BTC Bitcoin has recently exhibited some intriguing patterns that warrant attention from both technical analysis and on-chain analysis perspectives. According to Baro Virtual, CryptoQuant author and analyst, a bearish divergence on the BTC Average Return Index suggests a possible pullback to $26,000. Simultaneously, on-chain analysis indicates a weakening return index performance alongside a rising Bitcoin price, potentially signaling a phase of re-accumulation that may benefit investors seeking lower prices. The transition of the return index into the negative zone suggests a shift in market sentiment towards re-accumulation. Related Reading: Terra Luna Token Burn Proposal Greenlit – Could $1 Be Hittable? Re-accumulation typically occurs when long-term investors or institutions acquire Bitcoin at lower prices, anticipating future price appreciation. This behavior can be seen as a positive sign for the market’s long-term health, reflecting increased interest from strategic investors. As of the current update, BTC has broken out of its range which has persisted since the beginning of August. It is trading at $29,600, reflecting a 2.5% increase over the past 24 hours. However, the upward price movement of BTC in the short term may not be sustained unless accompanied by substantial trading volume. Several significant resistance levels lie ahead, posing challenges for BTC’s attempt to reclaim the $30,000 milestone. To begin with, the $29,700 zone presents a formidable barrier, followed by subsequent resistance walls at $30,000, $30,700, $31,200, and $31,500. In the short and mid-term, BTC, the largest cryptocurrency in the market, will need a compelling catalyst to push beyond these levels. Without such, a retracement is possible in the coming weeks. Featured image from iStock, chart from TradingView.com
Almost the entire digital asset economy is on Ethereum. Around 95% of all protocol revenue across the crypto space accrues to Ethereum Practically every major scalability project is on Ethereum, including every notable layer 2 project: https://l2beat.com/scaling/summary And this is just the beginning. Ethereum provides by far the most hope of making crypto ubiquitous, through…
Read more
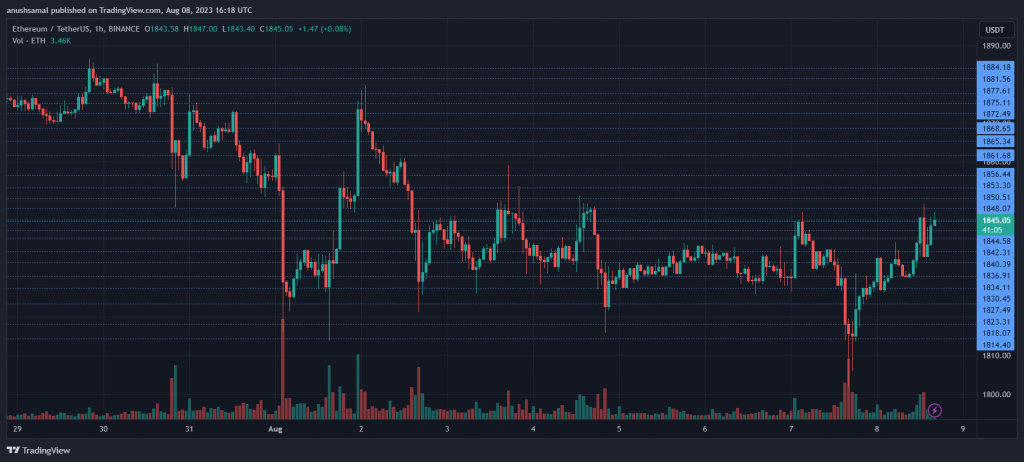
In recent weeks, Ethereum has demonstrated a downtrend in shorter timeframes, where the bulls struggled to maintain the critical $1900 support zone. This allowed the bears to gain dominance. However, there appears to be a change in price sentiment during recent trading sessions. Related Reading: Terra Luna Token Burn Proposal Greenlit – Could $1 Be Hittable? On the daily chart, ETH experienced a 2% climb. A positive movement is observable on the weekly chart, although it remains relatively modest. Despite the upward movement, there is a potential risk of waning bullish momentum if Ethereum fails to sustain its price above the immediate trading zone. From a technical standpoint, the altcoin is leaning toward bullishness, with increased buying strength apparent in recent trading sessions. Both accumulation and demand have played a role in this positive shift. Furthermore, Ethereum’s market capitalization has grown, indicating heightened demand during the past trading sessions. At the time of writing, ETH was priced at $1,840. It is currently nearing its immediate resistance level of $1,850, which has previously functioned as a liquidity pocket. Approaching this level might trigger a price decrease. However, if the altcoin successfully surpasses $1,850 and establishes a trading position above the subsequent resistance at $1,870, it could signal a more prolonged period of bullish activity. On the flip side, the support level is $1,780, followed by another at $1,760. Falling within this range might lead to further downward movement in the price. The trading volume of ETH in the previous session was lower. However, the fact that it was in the green indicates that buyers were gradually entering the market. Technical Analysis Regarding buyer activity, there has been increased demand for the altcoin following a notable dip within the past 48 hours. The Relative Strength Index (RSI) climbed above the 60 mark, suggesting a revival for the altcoin and signaling buyer engagement surpassed seller activity. Furthermore, the price remained above the 20-Simple Moving Average (SMA) line, indicating that buyers were the driving force behind the market’s price momentum. Another observation is that ETH remained above the 200-Simple Moving Average (SMA) line (green). This suggests a substantial price surge could be anticipated before the bullish momentum wanes. Correlating with the increase in demand, ETH exhibited buy signals on the daily chart. The Moving Average Convergence Divergence (MACD), which signifies price momentum and potential shifts, showed green histograms aligned with buy signals. These buy signals also suggest a potential upward movement in the price over the subsequent immediate trading sessions. Related Reading: Bitcoin Miners Show Accumulation Again, Bullish Sign? Additionally, the Bollinger Bands appeared wide from each other, indicating the likelihood of price volatility, although not overly significant as the bands mainly remained parallel. These parallel bands coincide with the immediate resistance level. Featured image from Unsplash, charts from TradingView.com

I’m creating a utility token for my project, however I’m stuck at how much I should send myself. What’s a standard amount for legit projects? I wouldn’t want to own half the supply for example, as that’s a huge risk to people who might want to hold the token for example. submitted by …
Read more
The account has made multiple posts promising a token giveaway and ushers users to a copycat website to connect their crypto wallet.
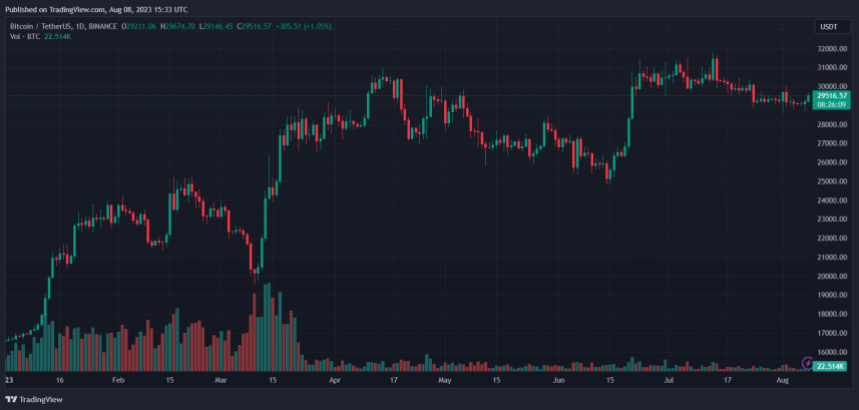
The Bitcoin price has experienced a slight uptick in the past 24 hours as bulls defended critical support. The number one cryptocurrency by market cap might try another run north of critical resistance, but recent data points towards further sideways price action. Related Reading: Terra Luna Token Burn Proposal Greenlit – Could $1 Be Hittable? As of this writing, Bitcoin trades at $29,400 with a 2% profit in the past day. Over the past week, the cryptocurrency has recorded similar profits while the rest of the market stalls or sees losses. Key resistance stands at around $30,000, but BTC failed to breach it on every recent occasion. Bitcoin Price Prepares… For Monotony? Over the past two years, the Bitcoin price has been moving in tandem with macroeconomic forces. In particular, BTC reacts to the tension from the U.S. Federal Reserve (Fed) and its interest rates hike program. The financial institution is entering a quiet period due to summer vacations. As a result, according to crypto analysis firm Blofin, Bitcoin and the crypto market will likely stay within their current range until September. Over this period, price movements and volatility spikes will continue to decline as the low liquidity environment impacts price action, and institutions hedging their positions impact volatility, Blofin stated. Furthermore, the report claims that potential interest rate hikes are “somewhat priced in” and could be inefficient in propelling BTC above $30,000. The current macroeconomic landscape could persist until May 2023 as inflation, the key reason behind the interest rates hike, becomes sticky. The above could translate into sideways price action until that period or until the U.S. Fed decides to cut interest rates paving the way for more risk appetite across the sector. Blofin stated: (…) investors seem to have become accustomed to daily life at high interest rates. The lack of liquidity has left investors with little interest in “trading”. Most investors are sitting on the sidelines. Bitcoin Investors Brace For Impact The chart below shows monthly trading volume across crypto exchanges has declined since July 2022. The report stated that this status quo reflects investors’ lack of interest in crypto, with BTC recording intraday price movements of around 0.1%, a first for the cryptocurrency in such an extended period. Related Reading: Bitcoin Miners Show Accumulation Again, Bullish Sign? In that sense, the crypto research firm believes that, due to the lack of strength around BTC and ETH, prices are likely to see a dip: (…) it is not difficult to find that when the price of BTC is around $30,000, and the price of ETH is around $2,000, both will lose further upward momentum here, hovering for a while, and then fall. The time to hit both levels was short or long, but further price breakouts did not occur. There seems to be an invisible ceiling around these two levels (…) Cover image from Unsplash, chart from Tradingview