Category: Cryptocurrency News

Cryptocurrency News and Public Mining Pools

Bitcoin Coinbase Premium Surges, Recovery Being Driven By US Investors?

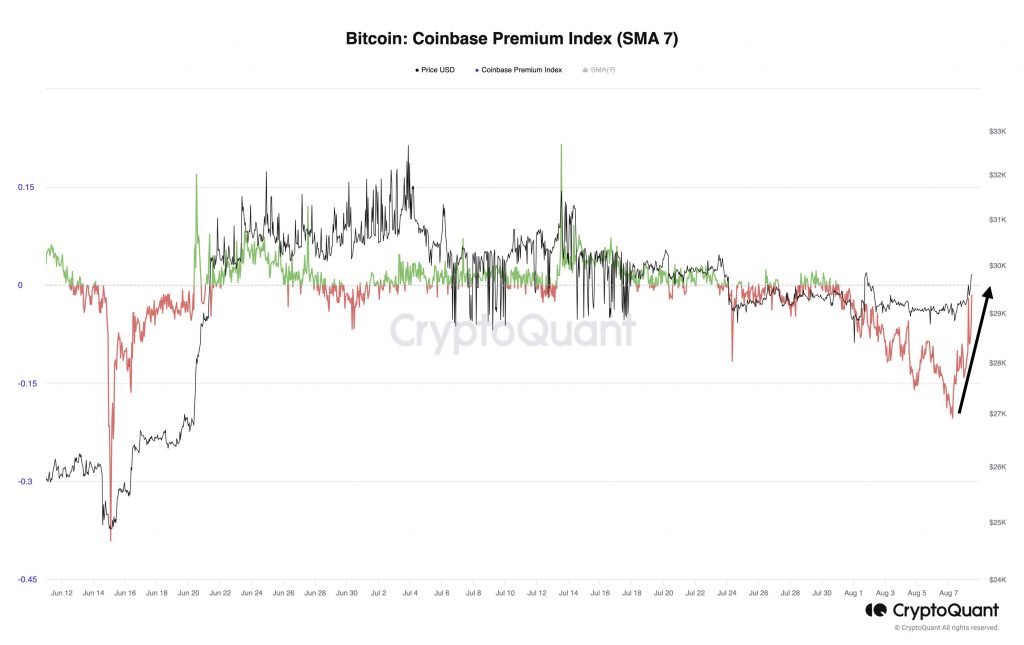
Data shows the Bitcoin Coinbase Premium Index has recently seen a surge, a sign that buying from US investors may contribute to the recovery. Bitcoin Coinbase Premium Index (7-Day SMA) Has Been Going Up Recently According to data shared by Julio Moreno, the Head of Research at CryptoQuant, the Coinbase Premium Index has been sharply trending up recently. The “Coinbase Premium Index” here refers to a metric that keeps track of the percentage difference between the Bitcoin price listed on Coinbase (USD pair) and that listed on Binance (USDT pair). This metric can help us know which platform’s user base is buying or selling more of the asset. For example, when the index’s value is greater than zero, it means that an extra amount of buying pressure has been present on Coinbase, which has pushed the asset’s price up on the platform (or just a lower amount of selling pressure than on Binance is there on Coinbase). Coinbase is known to be used more heavily by US-based investors (especially large institutional traders), while Binance’s traffic is spread around the globe. Thus, if more buying is happening on Coinbase, it can be a sign that the US-based investors are participating in more buying than the global traders. Related Reading: Bitcoin Miners Show Accumulation Again, Bullish Sign? Now, here is a chart that shows the trend in the 7-day Simple Moving Average (SMA) Bitcoin Coinbase Premium Index over the past couple of months: The 7-day value of the metric seems to have been rising in recent days | Source: Julio Moreno on X As displayed in the above graph, the 7-day SMA Bitcoin Coinbase Premium Index has only been negative this month, implying that the global investors have either outpaced the US traders in accumulation or the Americans have been selling to a higher degree. Recently, however, as news has started to come out that the probability of the BTC spot ETFs being approved in the US is increasing, the indicator has turned around and is now heading up. The metric has sharply increased in the past day, suggesting that the US-based institutional traders may now be participating in some heavy buying. Related Reading: Litecoin Long-Term Holders Smartly Exited Before Halving, Data Shows During this same period, Bitcoin has observed a recovery rally in which the cryptocurrency’s price briefly managed to touch the $30,000 mark before falling back to the current levels. Naturally, the timing of the rally and the 7-day Coinbase Premium Index sharply going up could imply that the buying from the American holders are providing the fuel for the move. The Grayscale Bitcoin Trust (GBTC) Premium, a metric that checks for whether GBTC is trading at a premium or a discount, has also been trending up recently, implying that the discount on the fund is decreasing (although it’s not near the positive territory yet unlike the Coinbase Premium Index). Looks like the metric’s value is becoming less negative | Source: CryptoQuant GBTC is a fund that allows users to get indirect exposure to Bitcoin in a way that traditional investors would be more familiar with. Thus, this metric holds hints about the buying or selling activity in which the more conventional US institutional traders are currently participating. BTC Price At the time of writing, Bitcoin is trading around $29,800, up 1% in the last week. BTC has observed some uplift during the past day | Source: BTCUSD on TradingView Featured image from Kanchanara on Unsplash.com, charts from TradingView.com, CryptoQuant.com

In 55 hours, Kraken became the #1 non Reddit wallet for Moons, acquiring ~2.8M Moons and passing the previous top “wallet” Gate IO exchange.

In just over 55 hours, Kraken has become the number one wallet for Moons as users have deposited approximately 2.8M moons. If we exclude Reddit owned Moons and burnt Moons in the dead wallet – that leaves 78.33M Moons in circulation. Meaning in ~55 hours users moved 3.5% of the (non reddit owned) circulating supply…
Read more

Daily General Discussion – August 10, 2023 (GMT+0)

Welcome to the Daily General Discussion thread. Please read the disclaimer and rules before participating.   Disclaimer: Consider all information posted here with several liberal heaps of salt, and always cross check any information you may read on this thread with known sources. Any trade information posted in this open thread may be highly misleading,…
Read more

Solana Recovery: Bulls Have To Keep Shielding Against Price Dip To Key Level

The Solana price exhibited a bullish trend during the recent trading session, pushing it beyond the $24 mark. It surpassed a key resistance hindering its progress for over a week. Within the last 24 hours, SOL saw a rise of around 6%, with a similar price increase visible on the weekly chart. Related Reading: XRP Price: Breaking This Key Resistance Could Propel Crypto To $21 By 2025 – Analyst From a technical standpoint, Solana’s outlook appears optimistic following the recent price shift. Both demand and accumulation have expanded on the daily chart, reflecting positive sentiment. Despite bullishness, the speed of SOL’s recovery depends on its ability to swiftly overcome the immediate barrier, which had previously acted as a tough resistance level. Additionally, the bulls must ensure that the price remains above the local support, as a drop below would invalidate the bullish thesis. Furthermore, Solana’s market capitalization has improved, indicating a gradual inflow of buyers into the market now. Solana Price Analysis: One-Day Chart Trading at $24.84, SOL has successfully breached the $23 resistance level, marking a growth of nearly 6%. This upward movement has reignited buyer interest, yet for Solana’s recovery to persist, it must exceed the $25 threshold. Breaking past this point would enable the bulls to advance by an additional 8%, with a potential target of $27. Conversely, the primary support levels for this altcoin are situated at $24 and subsequently at $22. A drop below $22 would revive bearish momentum, possibly prolonging a bearish phase. Technical Analysis As Solana surpassed the $23 level, there was a surge in demand for the coin, leading to an overbought condition. The Relative Strength Index rested just below the 70 mark, indicating a predominance of buyers in the market. Similarly, SOL maintained its position above the 20-Simple Moving Average line, indicating buyers were steering the price momentum. Notably, Solana was also above the 200-SMA (green) line, signifying a state of bullishness. Despite its bullish trajectory, the potential for a price pullback cannot be dismissed, considering that SOL was still near the overbought zone. Aligned with the heightened demand, SOL has generated buy signals on the chart. The Moving Average Convergence Divergence (MACD), responsible for gauging price momentum and shifts, has given rise to these green histograms. These histograms correspond to buy signals, suggesting that the price might experience a rise before a corrective phase ensues. Related Reading: Bitcoin Retraces Back From $30,000 As Profit Taking Spikes The Bollinger Bands, reflecting volatility, displayed significant widening, implying potential price fluctuations. However, these bands have also curved and ascended, pointing to an impending northward movement in the upcoming trading sessions. Featured image from Bloomberg, charts from TradingView.com

Polygon SubNet Architecture Analysis: How Polygon plans to scale out

TLDR at the bottom Recently, Polygon announced a new roadmap, branding and architecture for how they plan to scale out the Polygon stack. In this post, I am interested in breaking down how this architecture operates and how it can positively impact the Polygon network. Polygon Rebrand Polygon’s rebrand from MATIC to POL, made some…
Read more

Bitcoin miner Riot Platforms trims Q2 loss to $27.7M

The firm managed to narrow net loss in the quarter as it ramped up Bitcoin production.

Toncoin (TON) Surges As Crypto Market Rebounds, Can Bulls Send The Price To $2?

The TON price currently hovers at $1.28, representing a 4.54% price increase in the last 24 hours. Its price gain in the last 7 days stands at 7.58%. Toncoin is likely benefiting from the positive outlook of the global crypto market, standing at $1.18 trillion, representing a 1.42% gain in the last 24 hours. But how far can the rally go?  What Could Be Driving TON’s Price Gains? According to a Ton Developer Report, the ecosystem recorded a massive increase in developer involvement of up to 102% in 2023. This is a significant increase from its previous levels in 2016. In addition, the report noted several events within the ecosystem that could be spurring the present surge. They include the DoraHacks Hackathon, TON Wiki Challenge, and the TON Grants program.  Related Reading: XRP Price: Breaking This Key Resistance Could Propel Crypto To $21 By 2025 – Analyst Also, the TON Developers Chats community grew by 6.5% in Q2 2023, with 9,134 members by the end of June. This indicates rising interest among developers in the Toncoin network.  The DoraHacks Hackathon was a significant event for the ecosystem’s growth, as it boosted community engagement. The TON Wallet challenge also recorded 101 submissions from developers competing for a share in the $40,000 prize pool.  Similarly, the TON Wiki Challenge received 50 valuable contributions and rewarded 30 participants with a total prize of $5,000 in USD. Furthermore, the TVM challenge recorded the presentation of 11 projects with new features. The participants competed for a share in the $54,000 prize pool.  Finally, the Ton Web App Challenge presents concepts that cut across various ecosystems and their progress.  Aside from challenges, the TON Grants program supported 34 projects with approximately $66,000 in funding. These projects will likely positively affect the ecosystem once they are complete.  With these strategic programs, TON is transforming into a developers’ hub, and the increased activity on the network is driving its price gains.  Can TON Reach $2? TON shows limited trading activity with the small candles formed on the daily chart. It is trading below its 50-day and 200-day Simple Moving Average (SMA), expressing a bearish sentiment. Also, the 50-day SMA is about to drop below the 200-day SMA, forming a Death cross which confirms an increase in bearish pressure.  The Relative Strength Index (RSI) shows a value of 31.42, close to the oversold region 30. However, the RSI is moving sideways, confirming price volatility for the asset.  The Moving Average Convergence/Divergence (MACD) is below the signal line, also expressing a bearish sentiment. However, the Histogram bars are fading, hinting at a short-term price surge.  Related Reading: Bitcoin Price Losses Steam Above $30K But The Bulls Are Not Done Yet With all the indicators screaming bearish pressure, Toncoin will find it hard to sustain the rally in the short term and likely succumb to the rising pressure from the bears in the coming days. Featured image from Pixabay and chart from TradingView.com

GCR’s Staggering 450K MOON Token Acquisition Sparks Buzz

submitted by /u/AiryAndreGrande [link] [comments]

SEC to seek interlocutory appeal in Ripple Case

The SEC’s interlocutory appeal comes nearly a month after Judge Analisa Torre’s laid out her non-final ruling.

Cardano False Breakdown: Could It Set The Stage For A 26% Climb?

The recent drop in the price of Cardano (ADA) has raised concerns among investors as it breached the combined support of $0.3 and a crucial support trendline. However, a closer analysis of the daily chart reveals a twist that might offer a glimmer of hope for the cryptocurrency’s recovery. Technical analysis of Cardano’s price movement suggests that the apparent breakdown from the rising support trendline might be a fake one. Related Reading: Can Litecoin Bulls Turn The Tide On Recent Declines? A Closer Look A fake breakdown, also known as a false breakdown or a bear trap, occurs when a price temporarily drops below a support level or trendline but quickly rebounds, trapping bearish traders who sold during the dip.  This deceptive move often leads to a rapid reversal and upward momentum. Cardano: Fake Breakdown Or True Bearish Signal?  On the flip side, a decisive breakout from the overhead trendline could set the stage for a substantial 26% upswing in Cardano’s price, as per recent price analysis. This would not only mark a significant price recovery but also instill renewed optimism among traders and investors. Providing insights into the current market dynamics, it’s important to acknowledge the broader context surrounding Cardano’s performance. Despite the recent price turmoil, Cardano has demonstrated remarkable growth in terms of its total value locked (TVL). Crypto analytics firm Messari’s latest report reveals that Cardano’s TVL has surged by nearly 200% since the start of the year. Related Reading: XRP Price: Breaking This Key Resistance Could Propel Crypto To $21 By 2025 – Analyst Quarter-over-quarter (QoQ), the TVL increased by 9.7%, and year-to-date (YTD), it soared by an impressive 198.6%. This surge in TVL propelled Cardano from the 34th to the 21st position in terms of overall TVL among all blockchain networks. This remarkable feat underscores the growing adoption and utility of Cardano’s ecosystem. Setback Due To Regulatory Pressure  However, the journey to this achievement has not been without its challenges. The report points out that Cardano’s TVL experienced a dip in June, triggered by regulatory turbulence. The US Securities and Exchange Commission (SEC) charged cryptocurrency exchange Coinbase for allegedly offering unregistered securities, with ADA being specifically mentioned in the lawsuit. This development led to a sell-off of ADA and resulted in liquidations on Cardano-based decentralized finance (DeFi) platforms. ADA market cap currently at $10.4 billion in today’s chart: TradingView.com As of the latest data from CoinGecko, Cardano is currently trading at $0.299138. While the cryptocurrency has seen a 3.1% rally in the past 24 hours, it has also endured a 3.8% slump over the last seven days. Cardano’s recent price movement may appear bearish due to a seemingly significant breakdown from key supports. However, a careful analysis suggests the possibility of a fake breakdown, providing some ounce of optimism for a potential recovery. Amidst challenges, Cardano’s impressive TVL growth reflects its resilience and adoption within the crypto ecosystem. (This site’s content should not be construed as investment advice. Investing involves risk. When you invest, your capital is subject to risk). Featured image from Flickr