Category: Cryptocurrency News

Cryptocurrency News and Public Mining Pools

History’s Warning: Is Ethereum Set For A Huge Plunge? Here Is What This Analyst Predicts

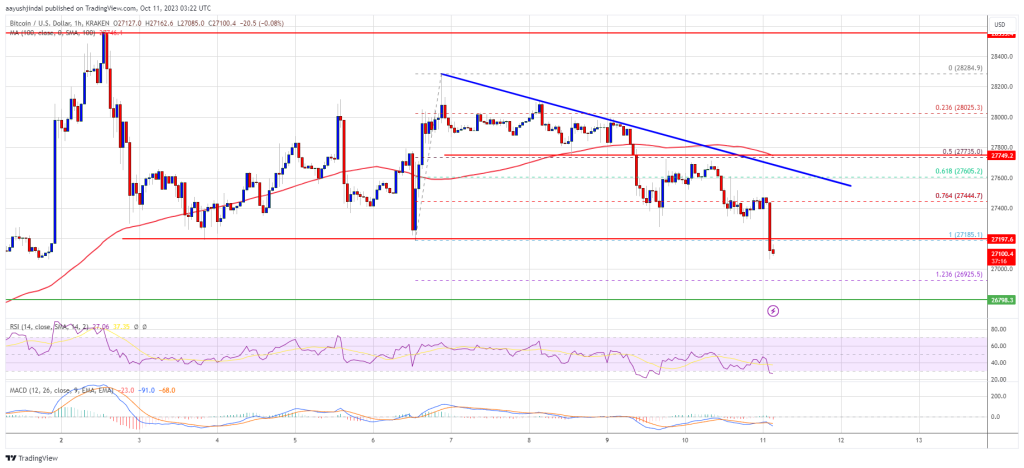
Ethereum (ETH) has maintained its spot as a leading altcoin. However, a recent analysis from Benjamin Cowen indicates that its journey, at least in comparison to Bitcoin (BTC), could have followed a better trajectory.  In a space where past trends can sometimes indicate future outcomes, ETH’s price behavior, when viewed against BTC, offers a tale of potential concern. Related Reading: Is Ethereum’s Staking Boom A Ticking Time Bomb? JPMorgan Weighs In Ethereum Stumbling Blocks In 2023 A leading voice in the crypto analytical community, Benjamin Cowen, expressed his lack of enthusiasm for ETH’s performance in 2023 during a YouTube video. The ETH / BTC valuation, a critical metric for gauging relative performance, is the bedrock for his statements. According to his observations from monthly charts, Cowen’s analysis primarily orbits around the ETH / Bitcoin valuation, which has trended downwards. The analyst cites patterns from 2019, a pre-halving year, where ETH’s value relative to BTC fell significantly. That year alone, the ETH / BTC valuation declined by about 49%. According to the analyst, fast forward to 2023, and ETH’s comparative valuation has already plummeted by 20.56%. If Cowen’s prediction and the patterns from 2019 hold any water, Ethereum could be staring down a deeper abyss. Yet, it’s not all bleak. Cowen remains measured, as he acknowledges the change the nature of “The Merge” brought on Ethereum’s ecosystem, believing it is a “game changer.” While Cowen wasn’t overly optimistic, the analyst refrained from forecasting ETH’s next moves, primarily due to the unpredictable ripple effects of The Merge. The Merge: A Game-Changing Variable? The Merge, a much-anticipated Ethereum upgrade, has already marked its influence on the ETH / BTC valuation. Ethereum’s weekly charts have been in a continuous downtrend following its implementation, creating further lows. Cowen recognizes that The Merge, with its deflationary component, could mean ETH might not toe its historical line. This deflationary aspect could be Ethereum’s wild card, making its trajectory even more elusive. Notably, while many parallels might be drawn between 2019 and 2023, such updates as The Merge means that Ethereum’s journey this year might still hold a few surprises. Related Reading: Here’s Why The Ethereum Price Fell Toward $1,500 Meanwhile, the Ethereum price against the US dollar has seen quite a bearish trend, particularly over the past week. The second largest crypto by market capitalization has plunged nearly 5% in the past 7 days, bringing its price to fall below $1,600 with a current trading price of $1,569. Featured image from Unsplash, Chart from TradingView

Some facts of Bitcoin as legal tender in El Salvador, what happened during these 2 years?

Next month is coming one of the most complete analyses of Bitcoin in El Salvador as legal tender from one of the biggest financial entities in Central America.. I am bringing from first hand here, I am sharing some facts will be included in the report. I will try to keep it simple. Chivo Wallet…
Read more

Bitcoin Price Slides As Bombs Rain on Gaza And Deaths Toll Rise

Bitcoin price is moving lower below the $27,200 support. BTC could decline further if the Israel-Hamas war escalates in the near term. Bitcoin is moving lower and showing bearish signs below $27,500. The price is trading below $27,500 and the 100 hourly Simple moving average. There is a key bearish trend line forming with resistance near $27,550 on the hourly chart of the BTC/USD pair (data feed from Kraken). The pair could accelerate lower below the $27,000 support in the near term. Bitcoin Price Starts Descend Bitcoin price failed to gain pace above the $27,800 resistance. BTC reacted to the downside amid rising Israel-Hamas tensions. There were more than 1200 deaths reported already by Israel. The price is moving lower below the $27,500 pivot level. There was also a downside break below the 76.4% Fib retracement level of the upward move from the $27,185 swing low to the $28,284 high. More importantly, the price traded below the key $27,200 support zone. Bitcoin is now trading below $27,500 and the 100 hourly Simple moving average. There is also a key bearish trend line forming with resistance near $27,550 on the hourly chart of the BTC/USD pair. If there is an upside correction, the price might face resistance near the $27,400 level. The next key resistance could be near the $27,500 level and the trend line. The first major resistance is $27,800, above which Bitcoin might test $28,250. Source: BTCUSD on TradingView.com The main downtrend resistance could be $28,500. A close above the $28,500 resistance could start another increase. In the stated case, the price could rise toward the $30,000 resistance. More Losses In BTC? If Bitcoin fails to recover higher above the $27,500 resistance, there could be more losses. Immediate support on the downside is near the $27,000 level or the 1.236 Fib extension level of the upward move from the $27,185 swing low to the $28,284 high. The next major support is near the $26,500 level. A downside break and close below the $26,500 support might send the price further lower. The next support sits at $26,000. Technical indicators: Hourly MACD – The MACD is now gaining pace in the bearish zone. Hourly RSI (Relative Strength Index) – The RSI for BTC/USD is now below the 50 level. Major Support Levels – $27,000, followed by $26,500. Major Resistance Levels – $27,400, $27,500, and $28,500.

How much does a blockchain developer earn

Want to become a blockchain developer here is a list on how much to earn per experience: https://www.dappuniversity.com/articles/blockchain-developer-salary TLDR: Experience: 0 years software experience, 0-1 years blockchain Salary: ~$110,000 per year Experience: 1-2 years software experience, 0-1 years blockchain Salary: ~$120,000 per year Experience: 2-4 years software experience, 0-1 years blockchain Salary: ~$124,000 per year…
Read more

Bitcoin Dominates 2023: Surges Past Stocks And Bonds With 63% YTD Growth

Bitcoin (BTC), the world’s leading cryptocurrency, continues to face challenges in reclaiming the $28,000 level amid rising US treasury yields, a stronger dollar, and geopolitical uncertainties.  However, according to a report by the digital asset research firm Reflexivity, despite these obstacles, Bitcoin remains the standout performer among asset classes in 2023, with an impressive year-to-date (YTD) return of 63.3%.  This exceptional performance has surpassed returns from US large-cap growth stocks (28%), US large-cap stocks (13%), bonds, commodities, and REITs, according to a report from New York-based Bitcoin investment firm NYDIG. ETH/BTC Ratio Reflects Risk Appetite And BTC’s Strength According to the firm’s latest analysis of the current state of the Bitcoin market, there is a notable importance in monitoring Bitcoin’s market cap dominance, which measures Bitcoin’s market capitalization as a percentage of the total crypto market capitalization. Market participants often view this metric as a risk gauge for the broader crypto market. Just as traditional markets experience cycles, with early stages marked by capital concentration in a select few high-quality assets that gradually disperse into riskier assets, the crypto market follows a similar pattern.  Related Reading: Dogecoin Price Faces Crucial Test: Will $0.055 Withstand The Pressure? The cycle commences with capital concentrated in Bitcoin, then dispersion into Ethereum (ETH) and eventually other altcoins. The cycle concludes with capital flooding into high-risk assets, as witnessed in the memecoin frenzy of 2021. The report’s chart illustrates the rising dominance of Bitcoin, indicating a healthy concentration of capital into the leading asset. Bitcoin’s sustained dominance suggests that the crypto market is stable, with significant capital still flowing into Bitcoin.  Alongside monitoring Bitcoin dominance, another key indicator of risk-taking behavior in the crypto market is the ETH/BTC ratio, which compares Bitcoin’s performance to Ethereum, the second-largest cryptocurrency by market capitalization.  The chart demonstrates a downward trend in the ETH/BTC ratio since the Merge in September 2022, which, according to the report, both Bitcoin dominance and the ETH/BTC ratio will be crucial to watch for any potential shift from a Bitcoin-dominated market regime into higher-risk assets.  Bitcoin Eyes Bullish Momentum After a two-month consolidation period between the $26,000 and $27,000 range, BTC finally experienced a surge of bullish momentum, breaking the pattern and climbing to the upside.  However, the cryptocurrency’s upward trajectory was halted as it encountered a formidable resistance wall in the mid-term, reaching $28,600 on October 2nd and facing a significant hurdle at $28,700.  This resistance level poses one of the final challenges preventing BTC from revisiting the $30,000 mark, last seen in August. Related Reading: Cardano (ADA) Struggles To Stay Above $0.26: What This Means For Traders Despite the setback, Bitcoin currently trades above its crucial 50-day and 200-day moving averages (MAs), indicating the potential for another attempt to breach previously lost levels.  Market analysts and enthusiasts are closely watching the $27,700 mark, as a successful break could signal the formation of a perfect ‘W’ pattern, with a target set at $28,100.  On this matter, renowned crypto YouTuber and founder of Crypto Sea, known as ‘Crypto Rover,’ highlights the significance of the $27,700 level as a potential catalyst for Bitcoin’s next move.  According to the analyst’s latest post on X (formerly Twitter), a successful breakthrough could reignite bullish sentiment and pave the way for a push toward the $28,100 target. BTC is trading at $27,300, experiencing a modest decline of 0.6% over the past 24 hours. However, the cryptocurrency has recorded notable gains of 4.4% and 6% over fourteen and thirty days, respectively. Featured image from Shutterstock, chart from TradingView.com 

Brazilian Congress puts Binance CEO CZ in crosshairs for indictment

A congressional committee has recommended that Changpeng Zhao and three local Binance executives be indicted for fraud and other financial crimes.

Bitcoin vs FIAT: How countries with hyperinflation would benefit if they adopted BTC 10 years ago?

We know that countries such as Argentina and Venezuela are having tough times with inflation for a couple of years already and this doesn't seem that is going to change anytime soon. How would this change if they instead of their own FIAT, adopted BTC for example? I made some calculations (Sorry, if there is…
Read more

Ethereum Open Interest Rising: Is This A Signal Bulls Have Been Waiting For?

Ethereum prices might be stagnant at spot rates, weaving around the $1,540 and $1,560 zone, looking at technical charts. However, amid this period of consolidation and holders worrying about Ethereum’s prospects, Kaiko notes that the coin’s open interest has been gradually rising since September 2023. Ethereum Open Interest Rising: What Does It Mean? As of October 10, Kaiko observes that there are more than 2.2 million contracts, and the number has been rising steadily over the past few trading weeks. With increasing open interest, it can hint that bulls are in the equation, which may support prices now that prices are under immense pressure. In crypto trading, open interest is the total number of outstanding derivative contracts of a given coin. Meanwhile, derivatives are contracts that derive value from the underlying asset, in this case, Ethereum. Herein, the total open interest data is accrued from ETH options, futures, and perpetual futures from platforms where traders can use leverage.  Related Reading: Cardano (ADA) Struggles To Stay Above $0.26: What This Means For Traders There can be different interpretations of open interest depending on the market state. Since open interest includes long and short positions at any time, gauging the directions of how market participants are posting trades can be challenging.  Even so, rising open interest indicates that more traders are opening positions, which can be seen as bullish, especially if prices are expanding. Conversely, falling open interest suggests that traders are exiting, which means waning momentum and bearish sentiment.  ETH Consolidates Even After Ethereum Futures ETF Approval Based on this, Ethereum remains in a critical position and support. Notably, the coin is moving sideways with low trading volumes.  From the daily chart, ETH is around the $1,500 and $1,550 primary support. Though buyers appear to be in control, since prices are boxed inside the June to July 2023 trade range, any break below the support zone may trigger more losses. The general optimism explaining rising open interest could be due to the recent approval of Ethereum Futures exchange-traded funds (ETFs). The United States Securities and Exchange Commission (SEC) approved multiple Ethereum Futures ETFs for the first time.  Related Reading: Here’s Why The Ethereum Price Fell Toward $1,500 This decision saw Ethereum prices edge higher in early October. Though prices have since contracted, institutional investors can now find exposure in Ethereum via structured and regulated products approved by the stringent regulator. It is unclear whether the rising ETH open interest signals strength and if the coin will recover going forward. From the daily chart, ETH has strong liquidation at around the $1,750 level and remains consolidated. Feature image from Canva, chart from TradingView

New Solana (SOL) Update Brings ‘Confidential Transfers’ for Increased User Privacy

submitted by /u/OMFGROFLMAO2 [link] [comments]