XRP Price Retest: A Prelude To A Stunning Surge To $2, Predicts Expert
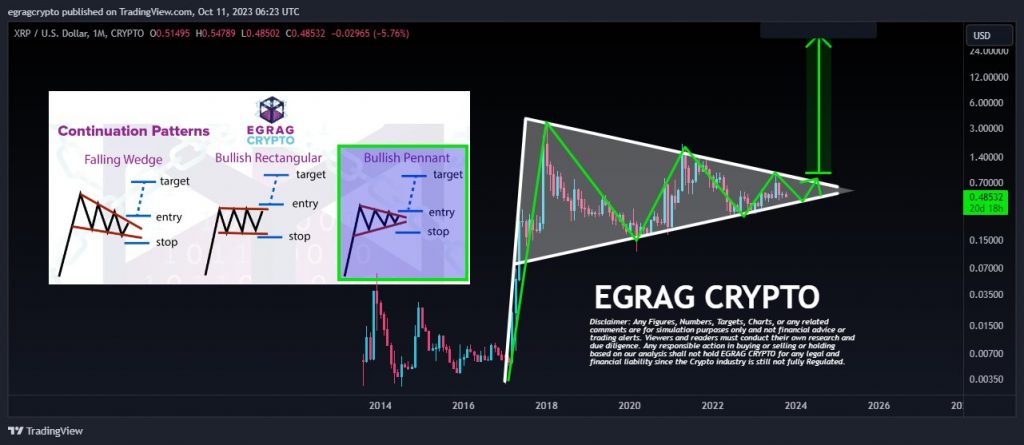
Renowned crypto analyst Egrag delivered a fresh and in-depth XRP price analysis across multiple timeframes today. As of press time, the cryptocurrency stands at $0.4825, marking a decrease of about 12% since October 3, when it reached a high of $0.5478. Despite the bearish momentum fueled by the broader crypto market trend, Egrag projects bullishness on higher time frames. Monthly Chart XRP/USD On the monthly XRP/USD chart, Egrag took to Twitter to share his insights, stating: “XRP Monthly Bullish Pennant – Super Bullish Sign: Do you spot the pattern like I do? It’s incredibly bullish!” According to Egrag, trading on a monthly time frame reduces the chance of false signals. He believes that a strong flagpole hints at a rapid price increase, and the ongoing consolidation phase forms the pennant. The current pause in the uptrend could potentially lead to further upward movement, especially if there’s a surge in volume after a breakout. For this scenario to occur, XRP shouldn’t break out to the downside, but stay within the two approximating lines until the breakout north. Related Reading: XRP Price Gearing Up For Rebound As Whales Make Their Move By measuring the flagpole’s height, Egrag anticipates that XRP could potentially surge above $24 (on a longer time scale) if it manages to break out of the bullish pennant pattern. Weekly Chart For the weekly chart, Egrag commented, “It’s evident that XRP is currently undergoing a retest phase following its recent breakout.” This sentiment is anchored in the aftermath of the Ripple Labs case against the US Securities and Exchange Commission, where the price broke out of a longstanding trend channel. However, the continued bearish sentiment in the broader crypto market, along with macro-economic pressures halted XRP’s momentum. Egrag points out the importance of the price range between $0.48 to $0.43, suggesting that maintaining above this line is critical. A breach could lead the cryptocurrency to retest the foundational zone between $0.25939 and $0.32630, which has shown robust support since 2017. Related Reading: XRP Is A Better Buy Now Than H1 2023: What’s Keeping Prices Low? Nevertheless, if the altcoin successfully retests and stays above the trendline, Egrag envisions a potential retest of the key resistance at $0.58304. Surpassing this would pave the way for an impressive rally, potentially reaching $2. According to him, XRP would thus penetrate the next higher “steel foundation”, the area between $1.6188 and $2. 1-Day Chart For the daily XRP/USD chart, Egrag’s message was concise: “XRP Army: Don’t miss the forest for the trees.” His analysis for this timeframe focuses on the “wicking” range of $0.3875 to $0.4719, which he sees as the possible dip range if the broader market pressure persists. Only a drop below $0.3875 would negate the bullish pattern. If the cryptocurrency maintains between $0.4719 and $0.5119, Egrag sees no cause for alarm. But for a bullish narrative to play out, the token needs to push beyond $0.5119, aiming for the $0.5738 mark, which corresponds to the 50% Fibonacci retracement level. Egrag emphasizes that breaching this level is crucial for a broader rally, targeting the 1,618 Fibonacci extension at $1.4694. At press time, the XRP price fell below the 61.8% Fibonacci retracement level and was trading at $0.4856, representing a loss of 3.3% in the last 24 hours. Featured image from Top1 Markets, chart from TradingView.com