Bitcoin Dominates Ethereum In Daily Active Addresses Despite Lagging In TX Count
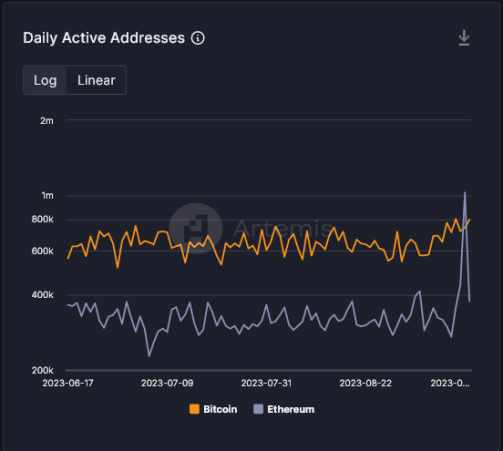
Ethereum might be the king of smart contracts and the world’s primary hub for decentralized finance (DeFi) and non-fungible tokens (NFTs) activity but onchain data suggests that Bitcoin is ahead in user engagement, interpreted by the number of daily active users, and network activity is at acceptable, healthy levels, reading from the number of daily transactions confirmed. Bitcoin Leads Ethereum In Daily Active Addresses According to Artemis Terminal data on September 15, Bitcoin, despite being predominantly a transactional layer, enabling the peer-to-peer (P2P) transfer of value between addresses, has more daily active users than Ethereum. This observation is even as Ethereum serves as a conduit of value since assets can be moved, just like in Bitcoin, and a smart contract platform for deploying trustless and automated decentralized applications (dapps). Some, like Uniswap, a decentralized exchange (DEX), process billions worth of transactions every month. Related Reading: Artist Stages Crypto Protest In Front Of US SEC With “Rug Pull” Exhibit On September 15, Bitcoin had over 800,000 daily active addresses (DAA), more than twice those in Ethereum, which stood at slightly over 378,000. The only time there was a slight change was on September 13, when over 1 million addresses were activated on Ethereum. Then, the number of DAA on Bitcoin also fell to around 743,000. However, the DAA on Ethereum has fallen sharply while Bitcoin has maintained an upward trajectory since late August. During this time, Ethereum’s DAA has been fluctuating heavily, as evidenced by the rise and fall on Sep 13 and through to today. Ethereum Processes Over 1 Million Transactions Everyday Ethereum shines in the number of daily transactions processed. When writing on September 15, the smart contract platform had processed over 1 million transactions while Bitcoin lagged, confirming less than 600,000. Even at this level, Ethereum has processed less than half of what it did on September 13, when the network processed over 2.3 million transactions. On the other hand, Bitcoin’s daily transactions have been steady, while those of Ethereum have, on average, risen over the past three months, as Artemis Terminal data shows. DAA and daily transaction count are important metrics that on-chain analysts use to analyze the level of engagement and health of public blockchains. Over the past 18 months, activity has rapidly shrunk as asset prices fall in the crypto winter. Ethereum’s drop from around $5,000 in late November 2021 to as low as $1,500 in 2022 weighed negatively on DeFi and NFT activity. Related Reading: Dogecoin Price Prediction for 2023, 2024, 2025, 2030 & Beyond According to DeFiLlama, the total value locked (TVL) of DeFi protocols has stabilized below $50 billion, down from around $180 billion in 2021. Meanwhile, trading volume has crashed by over 90%, dragging the value of NFT-related projects, including Immutable X and ApeCoin. To illustrate, APE is down 96% from peaks. Feature image from Canva, chart from TradingView