Category: Cryptocurrency News

Cryptocurrency News and Public Mining Pools

Nothing has changed since 2016

Its still same shit. I still get super anxious, when I have to do various hoops in order to attend some token / node launch. Swap tokens, pay insane fees for eth gas, bridge assets, send tokens around exhanges. Seriously nothing has changed, its still the same shit. You do 1 mistake and you lose…
Read more

Solana Co-Founder Anatoly Yakovenko Thinks Crypto Has a Shot at Disrupting the App Store Duopoly

Anatoly Yakovenko, co-founder of Solana Labs, believes that crypto can have a shot at disrupting Google’s and Apple’s app store duopoly. He criticized the state of the software distribution on mobile devices, lamenting that the two stores collected over 30% of all earnings just to display a top 10 list of the most downloaded apps. […]

Best overall trading platform for BC and ETH right now?

TradeStation sold my ETH at a loss ($2900) after I held it at a loss for 2 years because I bought in when it was high and two weeks ago they discontinued cryptocurrency services which I was unaware of until now. I’m thinking of using the $2900 to buy ETH again but I might add…
Read more

SOL Price Breaks $150 – Why Solana Could Soon Test $180

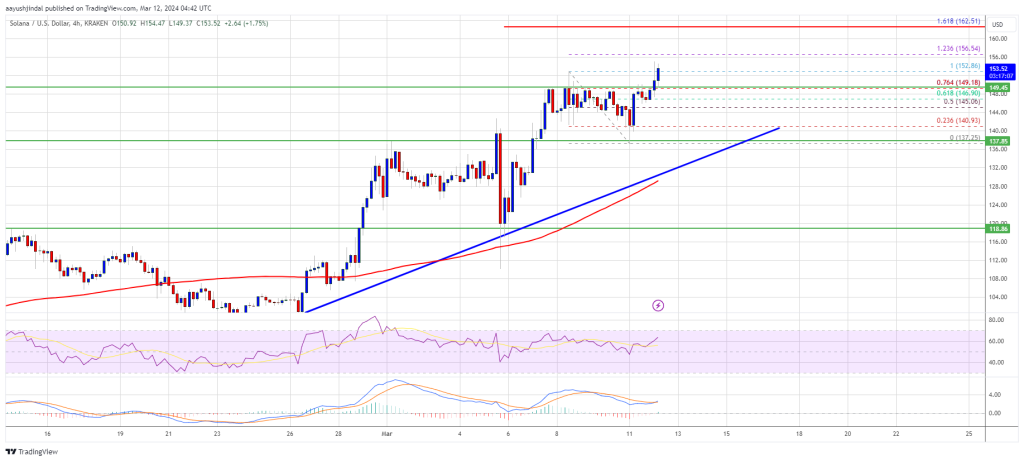
Solana is gaining bullish momentum above $150. SOL price is showing positive signs, and it could even surpass the $162 resistance in the near term. SOL price started a fresh increase from the $138 support against the US Dollar. The price is now trading above $150 and the 100 simple moving average (4 hours). There is a connecting bullish trend line forming with support at $140 on the 4-hour chart of the SOL/USD pair (data source from Kraken). The pair could continue to rally if it clears the $156 and $162 resistance levels. Solana Price Starts Fresh Rally Solana price formed a base above the $130 support zone and recently started a fresh increase. There was a decent increase above the $135 and $145 levels. The price is up nearly 10% and there was a move above the $150 level, like Bitcoin and Ethereum. The bulls pushed the price above the 76.4% Fib retracement level of the downward move from the $152.86 swing high to the $137.25 low. Solana is now trading above $150 and the 100 simple moving average (4 hours). There is also a connecting bullish trend line forming with support at $140 on the 4-hour chart of the SOL/USD pair. Source: SOLUSD on TradingView.com Immediate resistance is near the $156.50 level. The next major resistance is near the $162.50 level or the 1.618 Fib extension level of the downward move from the $152.86 swing high to the $137.25 low. A successful close above the $162.50 resistance could set the pace for another major increase. The next key resistance is near $175. Any more gains might send the price toward the $180 level. Are Dips Limited in SOL? If SOL fails to rally above the $162.50 resistance, it could start a downside correction. Initial support on the downside is near the $150 level. The first major support is near the $142.00 level, below which the price could test $138.00 and the trend line. If there is a close below the $138.00 support, the price could decline toward the $128.00 support or the 100 simple moving average (4 hours) in the near term. Technical Indicators 4-Hours MACD – The MACD for SOL/USD is gaining pace in the bullish zone. 4-Hours RSI (Relative Strength Index) – The RSI for SOL/USD is above the 50 level. Major Support Levels – $152.80, and $162.50. Major Resistance Levels – $150, $142, and $138.

Ethereum Price Uptrend To Continue? These Factors Could Send ETH To $4,300

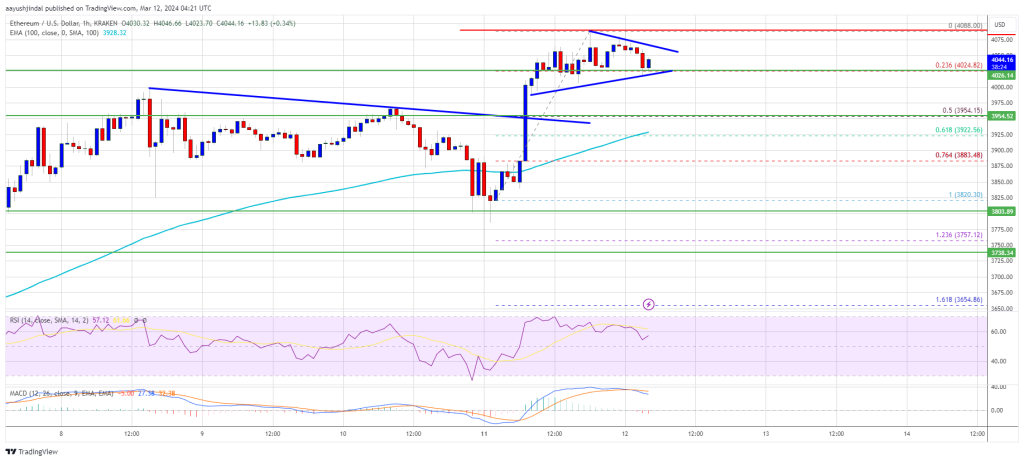
Ethereum price cleared the $4,000 resistance zone. ETH is now consolidating gains and might extend its increase above the $4,100 zone. Ethereum traded to a new multi-month high above $4,050. The price is trading above $4,000 and the 100-hourly Simple Moving Average. There is a short-term breakout pattern forming with resistance at $4,060 on the hourly chart of ETH/USD (data feed via Kraken). The pair could resume its increase if it clears the $4,080 resistance zone. Ethereum Price Reclaims $4K Ethereum price remained well-bid above the $3,880 level and extended its increase, like Bitcoin. ETH was able to clear the key $4,000 resistance to move further into a positive zone. The price settled above the $4,000 level. It traded to a new multi-month high above $4,000 and recently started a consolidation phase. There was a pullback below the $4,050 level. The price tested the 23.6% Fib retracement level of the recent increase from the $3,820 swing low to the $4,088 high. Ethereum price is now consolidating above $4,000 and the 100-hourly Simple Moving Average. There is also a short-term breakout pattern forming with resistance at $4,060 on the hourly chart of ETH/USD. If the pair stays above the $4,000 level, it could attempt another increase. Immediate resistance on the upside is near the $4,060 level. The first major resistance is near the $4,080 level. Source: ETHUSD on TradingView.com The next major resistance is near $4,120, above which the price might gain bullish momentum. In the stated case, Ether could rally toward the $4,220 level. If there is a move above the $4,220 resistance, Ethereum could even rise toward the $4,300 resistance. Any more gains might call for a test of $4,350. Are Dips Supported In ETH? If Ethereum fails to clear the $4,060 resistance, it could start a downside correction. Initial support on the downside is near the $4,020 level. The first major support is near the $3,950 zone or the 50% Fib retracement level of the recent increase from the $3,820 swing low to the $4,088 high. The next key support could be the $3,920 zone. A clear move below the $3,920 support might send the price toward $3,880. Any more losses might send the price toward the $3,780 level. Technical Indicators Hourly MACD – The MACD for ETH/USD is losing momentum in the bullish zone. Hourly RSI – The RSI for ETH/USD is now above the 50 level. Major Support Level – $3,950 Major Resistance Level – $4,080

Sunrising Community Currency Beta 🌅

submitted by /u/mvea [link] [comments]

Asking for a friend. That friend is me.

Can anyone please explain to me why someone would want to use a blockchain that costs $30 (on the low end) to send $100 when they could use a blockchain that costs $0.01 to send $thousands? submitted by /u/sirmartymcfly [link] [comments]

JPMorgan CEO Jamie Dimon Says He ‘Won’t Personally Ever’ Buy Bitcoin

The chief executive of JPMorgan Chase, Jamie Dimon, has doubled down on his anti-crypto stance, declaring that he will never personally buy bitcoin. His investment bank, however, is an authorized participant for Blackrock’s spot bitcoin exchange-traded fund (ETF). Despite his personal reservations about bitcoin, Dimon acknowledged his clients’ interest and championed their freedom to invest. […]

Requesting advice regarding paper wallet

I have a www.MyEtherWallet.com paper wallet created in 2017. I have sent ether to it several times over the years up until 2021. Now I am having difficulty sweeping the assets. I have confirmed on multiple blockchain explorer sites that the balance is intact. I have tried probably 10 different wallet apps. They all fail…
Read more

Bitcoin Price Resumes Rally As The Bulls Now Aim For $75K

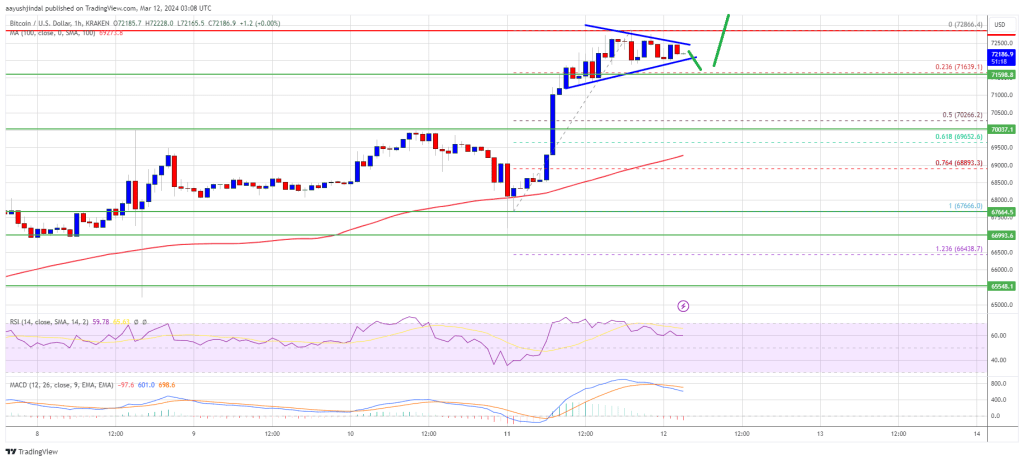
Bitcoin price started another increase above the $70,000 resistance. BTC cleared $72,000 and now the bulls seem to be aiming for a move toward $75,000. Bitcoin price started another increase above the $70,000 and $71,000 levels. The price is trading above $71,500 and the 100 hourly Simple moving average. There is a short-term contracting triangle forming with resistance at $72,500 on the hourly chart of the BTC/USD pair (data feed from Kraken). The pair could continue to move up if it clears the $72,500 and $72,850 resistance levels. Bitcoin Price Sets New ATH Bitcoin price remained stable above the $68,000 level. BTC formed a support base and recently started a fresh increase above the $70,000 resistance. The bulls pumped the price above the $72,000 level. The price traded to a new all-time high at $72,866. It is now consolidating gains near the 23.6% Fib retracement level of the upward move from the $67,666 swing low to the $72,866 high. There is also a short-term contracting triangle forming with resistance at $72,500 on the hourly chart of the BTC/USD pair. Bitcoin is now trading above $72,000 and the 100 hourly Simple moving average. Immediate resistance is near the $72,500 level and the triangle zone. The next key resistance could be $72,850, above which the price could rise toward the $73,500 resistance zone. Source: BTCUSD on TradingView.com If there is a clear move above the $73,500 resistance zone, the price could even attempt a move above the $74,000 resistance zone. Any more gains might send the price toward the $75,000 level. Downside Correction In BTC? If Bitcoin fails to rise above the $72,500 resistance zone, it could start a downside correction. Immediate support on the downside is near the $72,000 level. The first major support is $70,000 or the 50% Fib retracement level of the upward move from the $67,666 swing low to the $72,866 high. If there is a close below $70,000, the price could start a decent pullback toward the $68,500 level. Any more losses might send the price toward the $66,600 support zone. Technical indicators: Hourly MACD – The MACD is now losing pace in the bullish zone. Hourly RSI (Relative Strength Index) – The RSI for BTC/USD is now above the 50 level. Major Support Levels – $72,000, followed by $70,000. Major Resistance Levels – $72,500, $72,850, and $73,500.