Category: Cryptocurrency News

Cryptocurrency News and Public Mining Pools

Parabolic Rally In The Making? Bitcoin Regains $70,000 As Traders’ Paper Profits Collapse To 3%

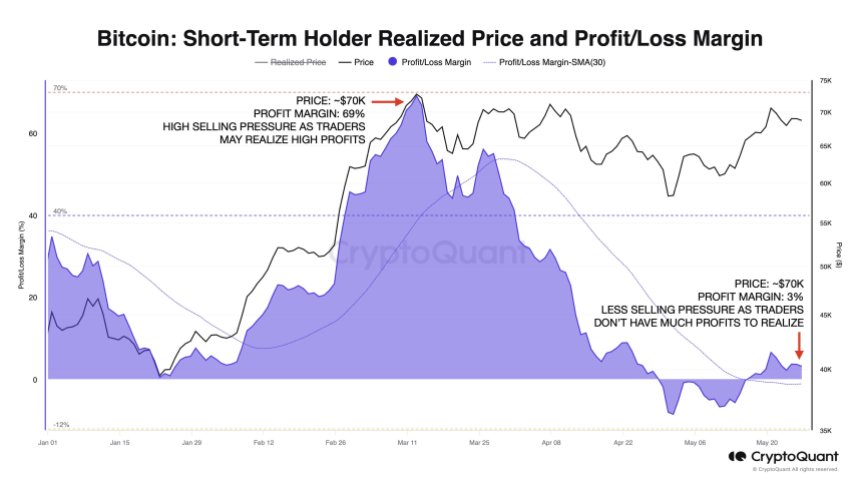
The world’s largest cryptocurrency, Bitcoin (BTC), has been consolidating over the past week, trading between $67,000 and $70,000 after experiencing a brief 20% price correction that sent it as low as $56,400 in early May.  This consolidation period comes as inflows into the US spot Bitcoin ETF market have reignited, and selling pressure appears to have cooled off, both in the ETF market and among Bitcoin investors more broadly. Bitcoin Selling Pressure Fades According to Julio Moreno, head of research at on-chain market analytics firm CryptoQuant, the current Bitcoin price level of $70,000 differs from when it last reached that mark in March.  Moreno notes that traders are now exerting much lower selling pressure, as unrealized profits are only around 3%, compared to 69% in early March. This suggests that much of the “heavy selling” has been exhausted, as seen in the chart below. Related Reading: DeFiance Capital Foresees ETH Soaring To $4,500 Pre-Ethereum ETF Trading Santiment data also shows that Bitcoin has once again eclipsed a $70,000 market capitalization, even as the US stock market took a hiatus for the Memorial Day holiday.  Market intelligence platform Santiment sees this as an encouraging sign, as it demonstrates BTC’s ability to perform positively on days when it is not closely correlated with the primary stock market, which has been the case for much of 2022. Final Pre-Breakout Consolidation Phase Despite this positive momentum, crypto analyst Rekt Capital has noted that Bitcoin’s latest weekly candle closed below the range high resistance of its ongoing “re-accumulation” phase, which spans roughly $60,000 to $70,000. This likely sentences the leading cryptocurrency to further consolidation within this range, aligned with Rekt Capital’s thesis that two phases remain in the current bull cycle: the post-halving re-accumulation phase and the “parabolic rally phase.” Historically, Bitcoin has tended to consolidate around all-time highs before embarking on the most illustrative stretch of its bull cycles. According to the analyst, Bitcoin has indeed been consolidating at these highs for quite some time now, especially by the standards of previous cycles.  While there is still room for further sideways trading at these elevated price levels, the time remaining in this phase is slowly running out. This leads to the belief that the long-awaited post-Halving rally, coupled with renewed investor sentiment, is poised to take the largest cryptocurrency on the market to even higher levels than the current $73,700 reached in mid-March. Related Reading: Crypto Analyst Predicts 28,900% Rally To $154 For XRP Price, Here’s When As such, Bitcoin appears to be entering a critical juncture in its current bull cycle. The consolidation and re-accumulation that has dominated the market in recent months could soon give way to the next parabolic surge, should historical patterns hold.  As of now, BTC has gained 2% in the past 24 hours, adding to its 10% positive movement in the past month alone. Bitcoin is currently trading at $70,200.  Featured image from Shutterstock, chart from TradingView.com

Something fishy is going on at Coinbase

Hello r/CC, today I noticed something very weird going on with both my sister's and my own Coinbase account. About a month ago, my sister noticed a $40 charge from Coinbase on her debit card. She hadn't used Coinbase for quite literally anything in over a year, so we login and see no transactions anywhere…
Read more

The legend of Kendu and the spirit of Shytoshi

It started with a whisper. Carried on the wind, barely audible. But for those who caught it, it was a signal, a great sign of a new dawn and a new legend. The alpha was undeniable. A mysterious connection to an ancient legend called Shytoshi who had promised enlightenment at the conclusion of the journey…
Read more

Mt. Gox-labeled wallets move billions in Bitcoin amid hopes of payback

Billions in Bitcoin reportedly belonging to collapsed crypto exchange Mt. Gox has moved to an unknown wallet.

Ethereum Shifts Gears: Breaks Key Resistance, New All-Time Highs Next

Ethereum (ETH) is currently at the forefront of an impending market surge, as indicated by a significant technical breakout. According to crypto analyst Jelle, Ethereum has recently emerged from a bearish pattern particularly breaking out from the “falling wedge” and flipping key resistance into support zones. Jelle reveals that Ethereum is currently pushing for the $4,000 mark which makes the possibility of reaching new heights seems more tangible. This movement marks a significant turnaround from previous trends, setting the stage for potentially record-breaking price levels. Related Reading: Ethereum Bullish Turn: Analyst Highlight Positive Bias In ETH Options Across All Expiries The Bullish Shift: Ethereum Breakout from a Falling Wedge Explained Jelle’s recent observations come during a period of strong performance for Ethereum, with the cryptocurrency showing a 30% increase in value over the past week alone. Ethereum stands at $3,951 at the time of writing, having climbed an additional 2.5% in just 24 hours. This notable uptrend underscores the growing investor confidence and market momentum that could drive Ethereum’s value to new records. Notably, a falling wedge pattern in technical analysis is a signal that often precedes a bullish market reversal. Characterized by converging trend lines that meet at a downward slope, this pattern typically concludes with a breakout to the upside as buying pressure overcomes selling momentum. $ETH broke out from the falling wedge, then flipped key areas into support & now pushes for $4,000. New highs, and new all-time highs are next. Higher. pic.twitter.com/pjrk8X2FYA — Jelle (@CryptoJelleNL) May 27, 2024 Ethereum’s recent breakout from this pattern signifies a potential reversal of its prior downtrend and transforms previous resistance levels into new supports, laying a foundational bullish sentiment. This technical progression is critical as it indicates a shift from bearish to bullish sentiment, suggesting that Ethereum might recover from its previous lows and embark on a sustained upward trajectory. Analysts like Jelle see this as a precursor to more aggressive buying behavior, potentially propelling the asset toward unprecedented price levels. Broader Market Sentiments And Predictions The positive outlook for Ethereum isn’t isolated. Notable crypto analyst Defi Mochi predicts that the ETH price could soar to between $9,500 and $12,000. According to Mochi, this projection is based on a combination of factors, including increasing political support for cryptocurrencies and the fact that Bitcoin has yet to reclaim its all-time high. With that said my realistic target for $ETH is approximately in the $9.5k to $12k range. Given ◆ increased political support for crypto ◆$BTC being barely at previous ATHs ◆ increased adoption of $ETH by institutions I Think none of us are bullish enough on Ultrasound Money. — Defi_Mochi (@defi_mochi) May 26, 2024 Institutional investors’ adoption of Ethereum is also a critical factor in the prediction. As more institutions integrate ETH into their portfolios, their market dynamics are expected to stabilize further, attracting more significant investment flows. Related Reading: Ethereum Nears Crucial Breakout: Could $4,000 Be The Next Move? Arthur, the founder of DeFiance Capital, aligns with this bullish sentiment, forecasting that Ethereum could reach $4,500 shortly. Featured image created with DALL·E, Chart from TradingView

Moon Week 49

Hello everyone and welcome to Moon Week for round 49 of Moons! For more information about Moons, please see our wiki page here. We are using Snapshot for voting directly with the Moon balance in your wallet, in a transparent and open manner. For now all Moons held in self-hosted wallets at the time of…
Read more

Any willing to give feedback on the beta of L2 marketplace project?

We’re looking for more honest feedback/criticism from Arbitrum Sepolia and Base Sepolia testers for the beta of our L2 marketplace project (if anyone's interested to help us out)! To not spam, we will only send out the link to those we are seriously interested. submitted by /u/Technical_Visual_272 [link] [comments]

Solana (SOL) Eyes a Strong Comeback: Will the Rally Ignite a Surge?

Solana found support near the $160 zone. SOL price is slowly rising and might gain bullish momentum if it clears the $172 resistance zone. SOL price corrected lower and tested the $160 support zone against the US Dollar. The price is now trading above $165 and the 100-hourly simple moving average. There was a break above a key bearish trend line with resistance at $164 on the hourly chart of the SOL/USD pair (data source from Kraken). The pair could clear the $172 resistance unless it fails to stay above $165. Solana Price Could Gain Momentum Solana price formed a support base near the $160 level and started a recovery wave. SOL underperformed Bitcoin and Ethereum but managed to clear the $165 resistance. There was a break above a key bearish trend line with resistance at $164 on the hourly chart of the SOL/USD pair. There was even a spike above the $170 zone and the 50% Fib retracement level of the downward move from the $181 swing high to the $160 low. Solana price is now trading above $165 and the 100-hourly simple moving average. Immediate resistance is near the $170 level. The next major resistance is near the $171 level. A successful close above the $172 resistance could set the pace for another major increase. The next key resistance is near $176 or the 76.4% Fib retracement level of the downward move from the $181 swing high to the $160 low. Any more gains might send the price toward the $180 level. Are Dips Supported in SOL? If SOL fails to rally above the $172 resistance, it could start another decline. Initial support on the downside is near the $167 level. The first major support is near the $165 level, below which the price could test $160. If there is a close below the $160 support, the price could decline toward the $150 support in the near term. Technical Indicators Hourly MACD – The MACD for SOL/USD is losing pace in the bullish zone. Hourly Hours RSI (Relative Strength Index) – The RSI for SOL/USD is below the 50 level. Major Support Levels – $165, and $160. Major Resistance Levels – $170, $172, and $180.

CCIP-088 – Remove only the complicated and obsolete karma calculations, keep only the urgent and essential CCIPs we need from day 1

Snapshot link: https://snapshot.org/#/cryptomods.eth/proposal/0x945906c52c4150297b395f1f009d8f64ac06e949deadbd0f2cc9da84f75fae26 There is currently a vote to remove all or keep all past CCIPs related to Moon distribution. Many may become obsolete or need to be re-worked if we use a new distribution system. However, not all of those CCIPs are gonna be obsolete, and a few are actually important to have from…
Read more

CCIP-087 – Abandon all CCIPs related to karma calculation for distributions

Snapshot voting link: https://snapshot.org/#/cryptomods.eth/proposal/0x19f32e28862cdce2c7caeecb18856f914b39a7d3cceea7b91104f9982021e15a Upon mod discussion regarding the first few CCIPs after Reddit Sunset their involvement in Moons it was brought up that the prior CCIP on this topic isn't technically binding due to the following conflicting wording. Please note that this poll will not set any new reward formula, but rather will serve…
Read more