Category: Cryptocurrency News

Cryptocurrency News and Public Mining Pools

Trump is good for Crypto. You’re not going to shame me into thinking otherwise.

I see everyone up in arms calling Trump a liar. I think he’s a lot of shit things but what I don’t think he is, is a liar. What I do know is that Biden and his administration def hates crypto, so I much rather take my chances this time going red. In all honestly,…
Read more

Luxor and Bitnomial launch Bitcoin mining derivatives product

The new crypto derivatives product allows investors to speculate on future hashrates and hashprices.

South African Central Bank Opts Against Publishing CBDC Study Findings

The South African Reserve Bank has reportedly decided not to unveil the findings of the initial phase of its central bank digital currency feasibility study. Instead, the central bank said it is currently focused on the second phase of the study and will release a report once it is satisfied with the progress made in […]

XRP Ledger Daily Payment Volume Soars 350%, Hitting 2 Million Transactions

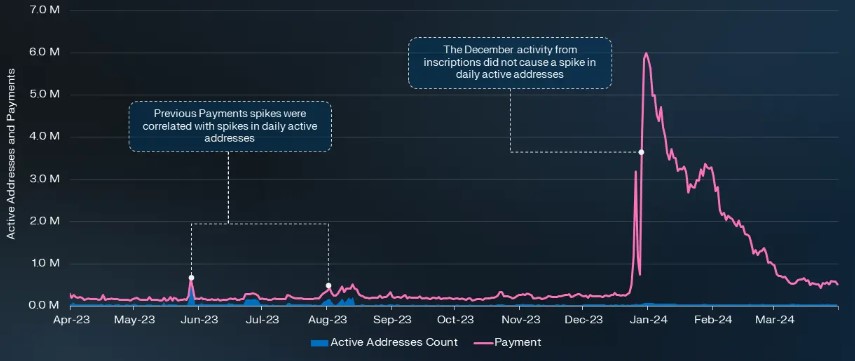
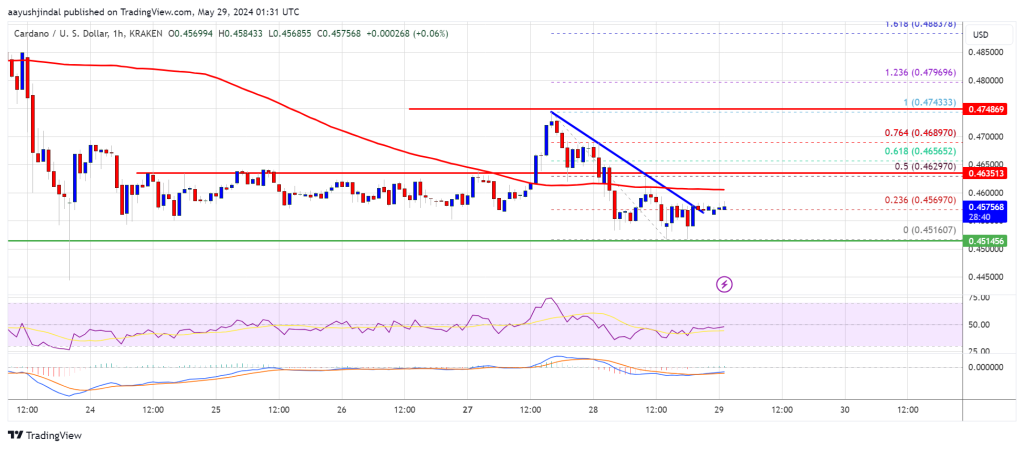
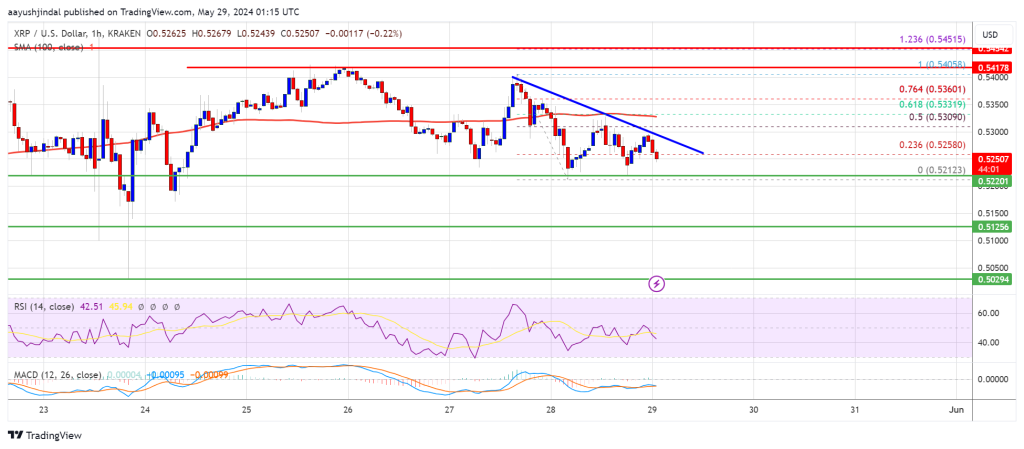
As a recent Messari report outlined, the XRP Ledger (XRPL) showcased notable progress during the first quarter of 2024. The decentralized public blockchain, which facilitates the transfer of XRP, fiat currencies, and other digital assets, has demonstrated substantial activity. XRP Ledger Burn Rate Slows Amid Low Fees During Q1 2024, XRP, the native token of the XRPL, secured its position as the sixth largest cryptocurrency by market capitalization, reaching $34.1 billion (currently $29M). Despite a slight price decrease, XRP’s circulating market cap witnessed a 1.3% growth quarter-over-quarter (QoQ). Related Reading: Forget Fear, Embrace Greed? Bitcoin Soars As Sentiment Turns Red Hot The XRPL employs a deflationary mechanism by systematically burning transaction fees. This process exerts downward pressure on the total supply of XRP, which stands at 100 billion tokens.  Since the inception of the XRP Ledger, approximately 12 million XRP have been burned. However, the low burn rate during Q1 can be attributed to the network’s relatively low transaction fees (less than $0.002 per transaction).  Additionally, 1 billion XRP is released from escrow to Ripple each month, with any unutilized tokens being placed into new escrow contracts. This pattern will continue until the remaining approximately 45 billion XRP becomes liquid; at this point, the deflationary pressure from burned fees will be the primary variable affecting supply. While XRP’s price decreased marginally 0.1% QoQ, lagging behind the overall crypto market’s 63.0% increase, it rose 14.8% year over year (YoY).  Inscription-Fueled Transactions Propel XRPL Daily Payments The report highlights that revenue in the XRPL is measured as total fees collected by the network, which are subsequently burned, contributing to the redistribution of wealth from transaction fee spenders to XRP holders. Network activity showed significant growth, with active addresses and transactions increasing by 37% and 113% QoQ, respectively. A substantial portion of transaction activity on the XRPL stemmed from inscriptions, a transaction type popularized in early 2023. Over 30 million transactions were sent to a single account by approximately 45,000 accounts engaged in inscription-related activities. According to Messari, inscriptions, facilitated by XRP Script, played a key role in driving the surge in daily payments, which soared 350% QoQ to 2 million transactions. Related Reading: $2.9 Billion In Mt. Gox Bitcoin On The Move For The First Time In 5 Years, Where Is It Headed? Lastly, the report notes that the XRP Ledger blockchain witnessed a net increase of 150,000 accounts, driving the total number of accounts up by 3.1% to 5.15 million in Q1. However, new addresses decreased 12.4% QoQ to 183,000, primarily due to the high number of addresses created in Q4, coinciding with the inception of inscription activity.  As of press time, XRP is valued at $0.5279, down 2.5% in the past 24 hours and 3.5% in the past seven days, which is in line with the broader market trend.  Featured image from Shutterstock, chart from TradingView.com 

Can Cardano (ADA) Bounce Back? A Closer Look at Its Recovery Potential

Cardano (ADA) corrected gains and tested the $0.4520 support zone. ADA must stay above the $0.450 support to start a fresh upward move. ADA price is struggling to gain bullish momentum above the $0.4750 zone. The price is trading below $0.460 and the 100-hourly simple moving average. There was a break above a connecting bearish trend line with resistance at $0.4570 on the hourly chart of the ADA/USD pair (data source from Kraken). The pair could gain bullish momentum if there is a close above $0.4620. Cardano Price Tests Support In the past few sessions, Cardano started a downward move after it failed to clear the $0.4750 resistance. ADA dipped below the $0.4620 support and tested the key support at $0.4520 like Bitcoin and Ethereum. A low was formed at $0.4516 and the price is now consolidating losses. There was a minor recovery wave above the $0.4550 zone. There was a break above a connecting bearish trend line with resistance at $0.4570 on the hourly chart of the ADA/USD pair. The pair tested the 23.6% Fib retracement level of the recent decline from the $0.4743 swing high to the $0.4516 low. Cardano is now trading below $0.4620 and the 100-hourly simple moving average. On the upside, immediate resistance is near the $0.4960 zone. The first resistance is near $0.4620 or the 50% Fib retracement level of the recent decline from the $0.4743 swing high to the $0.4516 low. The next key resistance might be $0.4750. If there is a close above the $0.4750 resistance, the price could start a strong rally. In the stated case, the price could rise toward the $0.50 region. Any more gains might call for a move toward $0.5250. More Losses in ADA? If Cardano’s price fails to climb above the $0.4620 resistance level, it could continue to move down. Immediate support on the downside is near the $0.4520 level. The next major support is near the $0.4460 level. A downside break below the $0.4460 level could open the doors for a test of $0.4320. The next major support is near the $0.420 level. Technical Indicators Hourly MACD – The MACD for ADA/USD is losing momentum in the bearish zone. Hourly RSI (Relative Strength Index) – The RSI for ADA/USD is now below the 50 level. Major Support Levels – $0.4520, $0.4460, and $0.4320. Major Resistance Levels – $0.4620 and $0.4750.

US Jury Convicts Two in $8M Crypto-Linked Dark Web Drug Scheme

A federal jury in Salt Lake City convicted Oluwole Adegboruwa and Enrique Isong, foreign nationals, of multiple drug-related charges. From 2016 to 2019, they generated over $8 million in cryptocurrency, including bitcoin and ethereum. Adegboruwa operated under the names “King Odua” and “Alagbada726,” converting cryptocurrencies to traditional currency. Sentencing is scheduled for August. The jury […]

XRP Price at Risk: Will It Sink or Swim at Key Support Levels?

XRP price is moving lower below $0.5350 support zone. It is now testing key support at $0.5220 and remains at risk of more downsides. XRP is struggling to gain bullish momentum above the $0.5350 resistance zone. The price is now trading below $0.530 and the 100-hourly Simple Moving Average. There is a connecting bearish trend line forming with resistance near $0.5265 on the hourly chart of the XRP/USD pair (data source from Kraken). The pair could start a fresh increase unless the bears push the price below $0.5220. XRP Price Revisits Support In the past two sessions, XRP price saw a bearish move below the $0.5320 zone like Bitcoin and Ethereum. The price declined below the $0.5250 support zone before the bulls emerged. A low was formed at $0.5212 and the price is now consolidating losses. It made a recovery attempt above the 23.6% Fib retracement level of the downward move from the $0.5405 swing high to the $0.5212 low. However, the bears are active near the $0.5300 zone. There is also a connecting bearish trend line forming with resistance near $0.5265 on the hourly chart of the XRP/USD pair. The price is now trading below $0.530 and the 100-hourly Simple Moving Average. Immediate resistance is near the $0.5265 level. The first key resistance is near $0.5320 or the 61.8% Fib retracement level of the downward move from the $0.5405 swing high to the $0.5212 low. A close above the $0.5320 resistance zone could send the price higher. The next key resistance is near $0.540. If there is a close above the $0.540 resistance level, there could be a steady increase toward the $0.5450 resistance. Any more gains might send the price toward the $0.5650 resistance. More Downsides? If XRP fails to clear the $0.5320 resistance zone, it could continue to move down. Initial support on the downside is near the $0.5220 level. The next major support is at $0.5120. If there is a downside break and a close below the $0.5120 level, the price might gain bearish momentum. In the stated case, the price could decline and retest the $0.50 support in the near term. Technical Indicators Hourly MACD – The MACD for XRP/USD is now gaining pace in the bearish zone. Hourly RSI (Relative Strength Index) – The RSI for XRP/USD is now below the 50 level. Major Support Levels – $0.5220 and $0.5120. Major Resistance Levels – $0.530 and $0.5320.

Is Mt. Gox A Worry For Bitcoin? Crypto Analyst Weighs In

Bitcoin outflows from the Mt. Gox exchange have occurred in the past day, making some worry about potential bearish effects. Here’s what an analyst thinks. Mt. Gox Has Made Several Bitcoin Transactions In The Last 24 Hours During the past day, several movements from wallets associated with the bankrupt cryptocurrency exchange Mt. Gox have been spotted on the Bitcoin blockchain. The platform had announced plans to repay its creditors, so the transactions are likely related to them. Mt. Gox has moved out 137,890 BTC in total, worth almost $9.4 billion at the current cryptocurrency exchange rate. With these transfers, the market has become concerned about whether these tokens will move towards trading, adding to the selling pressure in the market. Related Reading: Ethereum Deposits At 4-Month High: Whales Preparing For Selloff? As a result, the BTC price has fallen about 4% in the past 24 hours. While the market has reacted negatively to the news so far, some have wondered whether these withdrawals are actually going to be bearish. Analyst James Van Straten discussed this in an X post and provided perspective on how a potential selloff arising out of these repayments would compare against another that BTC witnessed recently. The distribution event in question is from the long-term holders (LTHs), which make up one of the two main divisions of the BTC market based on holding time. All investors holding onto their coins since more than 155 days ago qualify for this cohort, while those who bought within the past 155 days are put in the short-term holder (STH) group. The LTHs are considered to be the resolute side of the market, as they rarely participate in selloffs, while the STHs are the fickle-minded investors who regularly react to sector events by panic selling. The recent rally in the asset, though, proved to be enough to move even these HODLers into selling, as the chart below shows their total supply. As the graph shows, the LTH supply has been moving sideways in the last couple of months, but it was in a state of decline for five months before that. In this selloff, the LTHs sold around 1 million tokens, of which around 340,000 BTC was linked to GBTC outflows. At the same time, this distribution from the LTHs occurred, though the coin’s price marched to a new all-time high, implying that the market could absorb this massive selling pressure just fine. Straten notes that the Mt. Gox repayments are only about a tenth of this selloff, and not everyone who will get these tokens will decide to sell. At the very least, everyone wouldn’t sell at the same time. Related Reading: Injective (INJ) Buy Signal That Led To 700% & 555% Rallies Forms Again Thus, given this fact, it’s possible that Bitcoin may not be affected by this distribution if demand for the cryptocurrency remains as strong as it has been recently. BTC Price Bitcoin had risen above the $70,000 level earlier, but the Mt. Gox news has brought the asset down to $67,700. Featured image from Dall-E, Glassnode.com, chart from TradingView.com

Is Solana Preparing For Liftoff Or Meltdown? Analysts Forecast SOL’s Future

After the recent market pump, Solana (SOL) recovered an important support zone. As a result, analysts have debated whether the altcoin is poised for a liftoff to a new all-time high (ATH) or about to face a meltdown. Related Reading: Solana (SOL) Eyes a Strong Comeback: Will the Rally Ignite a Surge? Analysts Fear SOL’s Top Is In After recovering the $160 support zone over a week ago, Solana reached heights not seen since the beginning of April. SOL neared the $190 resistance level but failed to surpass it. Instead, the token’s price hovered between the $180 and $170 mark before returning near the $160 support zone over the weekend. Despite underperforming compared to Bitcoin (BTC) and Ethereum (ETH), the token reached a new ATH in a key metric during this cycle. In March, Solana’s market capitalization surpassed its previous ATH, reaching a market cap of $93 billion. Last week’s pump saw SOL surge by over 56% from its price during the May 1 retrace, propelling its market cap above its 2021 ATH to levels resembling March’s ATH. Nonetheless, some crypto analysts see the possibility of a meltdown ahead for Solana. Crypto analyst Bluntz posted a video looking at SOL’s macro chart. Per the post, the analyst considers that “SOL is done, SOL is exhausted, and it’s probably time for ETH to catch up, which will probably be the last leg of the bull market.” The analyst considers the macro chart to display some concerning signs that suggest the token has “probably topped.” Per Bluntz’s chart, SOL had a five-way climb to its cycle high of $210 in March. Despite not making the price ATH due to inflation, the analysts highlighted Solana’s market cap ATH as a key factor. Moreover, the crypto trader pointed out a five-way decline since March’s highs, followed by a three-way move up. To the analyst, this suggests that Solana is “exhausted” as it’s starting to struggle. According to Bluntz, there’s a high chance that the highlighted performance will result in a “macro lower high.” Additionally, he forecasted SOL’s price to retrace below the $100 mark. Is Solana Poised For A Liftoff Or A Meltdown? Similarly, pseudonym analyst Credible issued a warning regarding SOL’s future. To the analyst, “coins like $SOL are just in larger distribution structures now.” However, Credible considers that BTC’s strength will relieve SOL as it initially “drags the whole market up.” The analyst agreed with Bluntz’s prediction, stating that it is “ultimately where we are headed,” but considers there’s a good chance Solana sees highs above March’s mark “before the real meltdown.” Nonetheless, some crypto analysts disagree with the gloomy forecast. DocXBT asserted he has “seen a lot of terrible Solana takes lately.” The analyst believes the token is “holding daily trends” and displays positive support and resistance levels. Moreover, he considers that investors should “stop overthinking it” unless “we lose daily trends” as the performance looks “supper clean.” Related Reading: Keeping Up With The Memecoins: Caitlyn Jenner’s New Token Surges 50,000% Amid Controversy On a similar note, CryptoJelle pointed out that SOL is “forming the post-breakout higher low.” To the analyst, Solana is following the same behavior it did during the February-March leg. Ultimately, Jelle suggests that the token could have found its bottom, and it’s currently getting ready for liftoff to a new ATH. The analyst forecasted a $600 price prediction for SOL this cycle. Featured Image from Unsplash.com, Chart from TradingView.com

ZKasino gives investors 72-hour window to get back deposited ETH

ZKasino denied it tried to make off with $33 million of investor funds in April and has now opened up a short refund window.