Category: Cryptocurrency News

Cryptocurrency News and Public Mining Pools

Legendary Investor Declares Now Is The Time To Buy Bitcoin: Here’s Why

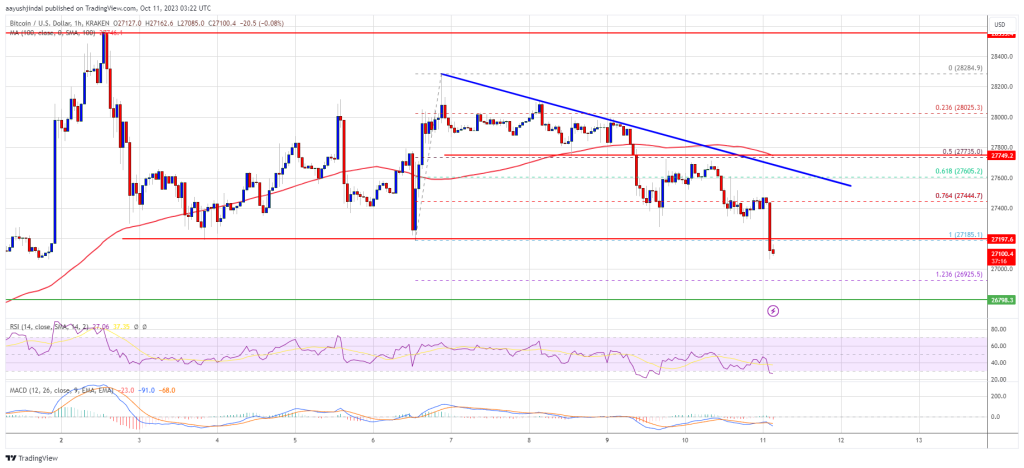
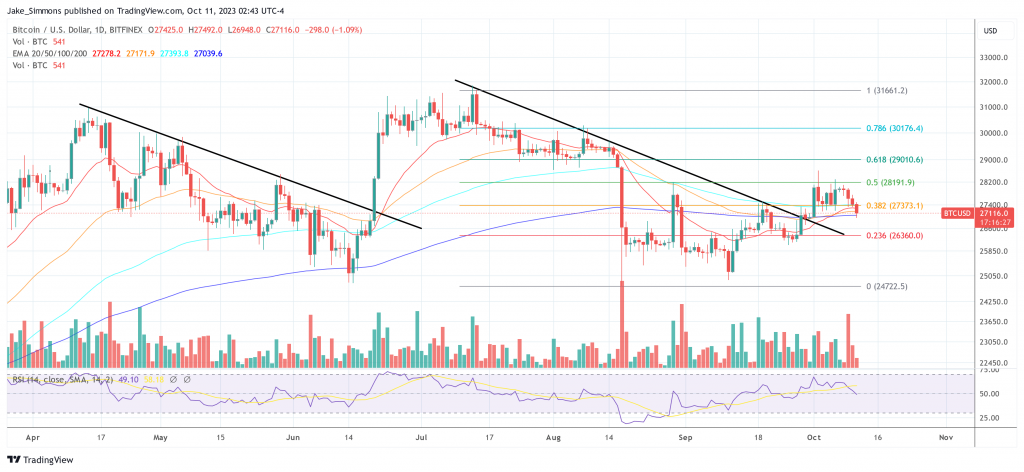
In a recent interview with CNBC, billionaire hedge fund manager and legendary investor Paul Tudor Jones expounded on his bullish stance on Bitcoin amidst mounting global tensions and economic uncertainties. Jones, an influential figure in the investment world, highlighted the current geopolitical environment as one of the most “threatening and challenging” he has ever witnessed and emphasized the importance of diversifying investment portfolios with assets like Bitcoin and gold. Jones told CNBC, “I love gold and bitcoin together. I think they probably take on a larger percentage of your portfolio than they would [historically] because we’re going to go through both a challenging political time here in the United States and we’ve obviously got a geopolitical situation.” Now Is The Time To Buy Bitcoin And Gold Recent global events have exacerbated these sentiments. Over the weekend, the Israeli government launched a military response against Hamas following an attack on Israel, escalating tensions in an already fragile Middle Eastern region. Additionally, Russia’s recent invasion of Ukraine and growing discord between China and the US have further rattled global markets and economies. Related Reading: Bitcoin Dominates 2023: Surges Past Stocks And Bonds With 63% YTD Growth In the same breath, Jones remarked on the US’s alarming fiscal position, stating it’s “probably in its weakest fiscal position since World War II.” Responding to concerns about the potential impact of high interest rates on Bitcoin, Jones delved deeper into the dynamics of gold and market trades preceding a recession. He stipulated, “I think on a relative basis what’s happened to gold, it has been clearly suppressed. But you know that more likely or not we are going into a recession.” Jones underscored a few hallmarks of recessionary trading environments, indicating, “There are some pretty clear recession trades. The easiest are: the yield curve gets very steep, home premium goes into the backend of the debt market and the 10-year, 30-year, 7-year paper, the stock market typically right before recession declines about 12%.” This decline, according to Jones, is not just plausible but likely to transpire at a certain juncture. Additionally, he emphasized the prospective bullish market for assets like Bitcoin and gold during economic downturns, stating, “And when you look at the big shorts in gold, more likely or not in a recession, the market is typically very long; assets like Bitcoin and gold.” Related Reading: Bitcoin And Crypto Poised To Skyrocket As Endgame Of US Policy Nears: Analyst Jones further prognosticated a substantial influx into the gold market, speculating, “So there’s probably $40 billion worth of buying coming in gold at some point before now and when that recession actually occurs.” Expressing his asset preference amidst the aforementioned conditions, Jones concisely noted, “So, I like Bitcoin and I like gold right now.” Jones’s endorsement of Bitcoin isn’t new as the investor had previously championed the digital currency in several interviews, citing its potential as a hedge against inflation and lauding its immutable mathematical properties. He once remarked, “Bitcoin is math, and math has been around for thousands of years.” By mid-2021, Jones even increased his Bitcoin allocation from 1-2%, labeling it as a “bet on certainty amid uncertain economic conditions.” Jones’s remarks came at a time when the cryptocurrency saw an approximate 63% increase year to date, making it the best-performing asset in 2023. At press time, Bitcoin was trading at $27,116, down roughly 2% over the past 24 hours. Amidst the recent price drop, BTC initially found support at the 200-day EMA (blue line), which the bulls should hold at all costs to avoid further downward momentum. Featured image from iStock, chart from TradingView.com

Securities regulators oppose special treatment of crypto in Coinbase case

A body representing North America’s state securities regulators took aim at arguments made by crypto exchange Coinbase in its defense against the SEC.

Bitcoin Cash Price Prediction: This Support Could Trigger Fresh BCH Rally

Bitcoin Cash price is holding the key $205 support against the US Dollar. BCH could start a fresh increase if it stays above the $205 and $200 support levels. Bitcoin cash price started a fresh decline below the $230 level against the US Dollar. The price is trading below $220 and the 100 simple moving average (4 hours). There is a key bearish trend line forming with resistance near $217 on the 4-hour chart of the BCH/USD pair (data feed from Kraken). The pair could start a fresh increase unless there is a move below $200. Bitcoin Cash Price Holds Support In the past few days, Bitcoin Cash price saw a steady decline from the $255 resistance zone. BCH declined below the $232 support to enter a short-term bearish zone, like Bitcoin and Ethereum. The bears were able to push the price below the $220 support. Finally, the price found support near the $205 zone (a multi-touch zone). A low has formed near $206.59 and the price is now consolidating losses. It seems like there is a key bearish trend line forming with resistance near $217 on the 4-hour chart of the BCH/USD pair. Bitcoin Cash is now trading below $220 and the 100 simple moving average (4 hours). Immediate resistance is near the $217 level and the trend line. It is close to the 23.6% Fib retracement level of the downward move from the $255 swing high to the $206 low. Source: BCH/USD on TradingView.com The next major resistance is near $228 or the 100 simple moving average (4 hours). The next major resistance is near the $232 level. It is close to the 50% Fib retracement level of the downward move from the $255 swing high to the $206 low. Any further gains could lead the price toward the $250 resistance zone. Downside Break in BCH? If Bitcoin Cash price fails to clear the $217 resistance, it could continue to move down. Initial support on the downside is near the $205 level. The next major support is near the $200 level, where the bulls are likely to appear. If the price fails to stay above the $200 support, the price could test the $184 support. Any further losses could lead the price toward the $162 zone in the near term. Technical indicators 4-hour MACD – The MACD for BCH/USD is losing pace in the bearish zone. 4-hour RSI (Relative Strength Index) – The RSI is currently below the 50 level. Key Support Levels – $205 and $200. Key Resistance Levels – $217 and $232.

Ethereum Price Targets Fresh Lows, Can Bulls Save This Key Support?

Ethereum price is struggling to stay above the $1,550 support against the US dollar. ETH could take a hit if it settles below $1,550 and then $1,540. Ethereum is showing bearish signs and struggling to clear the $1,600. The price is trading below $1,600 and the 100-hourly Simple Moving Average. There is a major bearish trend line forming with resistance near $1,600 on the hourly chart of ETH/USD (data feed via Kraken). The pair could start a recovery wave if the bulls defend the $1,550 support zone. Ethereum Price Struggles Ethereum failed to start a recovery wave above the $1,600 resistance zone. ETH remained in a bearish zone and extended its decline toward $1,550, like Bitcoin. It seems like the bears already attempted a close below the $1,550 support zone. A new swing low was formed near $1,542 and the price is now consolidating losses. The price is back above the $1,550 level, but it is still showing heavy bearish signs. Ethereum is now trading below $1,600 and the 100-hourly Simple Moving Average. Besides, there is a major bearish trend line forming with resistance near $1,600 on the hourly chart of ETH/USD. On the upside, the price might face resistance near the $1,570 level. It is near the 23.6% Fib retracement level of the downward move from the $1,664 swing high to the $1,542 low. The first major resistance is near the trend line and $1,600 or the 100-hourly Simple Moving Average. Source: ETHUSD on TradingView.com The 50% Fib retracement level of the downward move from the $1,664 swing high to the $1,542 low is also near the trend line. The next major resistance is $1,620, above which the price could rise toward the $1,665 resistance zone. A close above the $1,665 resistance might send the price toward the main resistance at $1,750. Any more gains might open the doors for a move toward $1,880. Downside Break in ETH? If Ethereum fails to clear the $1,600 resistance, it could continue to move down. Initial support on the downside is near the $1,550 level. The next key support is $1,540. A downside break below the $1,540 support might start another strong decline. In the stated case, the price could revisit the $1,480 level. Any more losses may perhaps send Ether toward the $1,420 level. Technical Indicators Hourly MACD – The MACD for ETH/USD is losing momentum in the bearish zone. Hourly RSI – The RSI for ETH/USD is now below the 50 level. Major Support Level – $1,540 Major Resistance Level – $1,600

Immutable links with AWS in latest Web3 gaming push

The blockchain gaming firm said it will gain access to a vast pipeline of game studio leads and support for successful deal closures.

British MPs urge action on NFT copyright infringement, crypto fan tokens

A U.K. parliamentary committee called for a crack down on sports fan tokens and recommended the government issue a code of conduct for NFT platforms.

History’s Warning: Is Ethereum Set For A Huge Plunge? Here Is What This Analyst Predicts

Ethereum (ETH) has maintained its spot as a leading altcoin. However, a recent analysis from Benjamin Cowen indicates that its journey, at least in comparison to Bitcoin (BTC), could have followed a better trajectory.  In a space where past trends can sometimes indicate future outcomes, ETH’s price behavior, when viewed against BTC, offers a tale of potential concern. Related Reading: Is Ethereum’s Staking Boom A Ticking Time Bomb? JPMorgan Weighs In Ethereum Stumbling Blocks In 2023 A leading voice in the crypto analytical community, Benjamin Cowen, expressed his lack of enthusiasm for ETH’s performance in 2023 during a YouTube video. The ETH / BTC valuation, a critical metric for gauging relative performance, is the bedrock for his statements. According to his observations from monthly charts, Cowen’s analysis primarily orbits around the ETH / Bitcoin valuation, which has trended downwards. The analyst cites patterns from 2019, a pre-halving year, where ETH’s value relative to BTC fell significantly. That year alone, the ETH / BTC valuation declined by about 49%. According to the analyst, fast forward to 2023, and ETH’s comparative valuation has already plummeted by 20.56%. If Cowen’s prediction and the patterns from 2019 hold any water, Ethereum could be staring down a deeper abyss. Yet, it’s not all bleak. Cowen remains measured, as he acknowledges the change the nature of “The Merge” brought on Ethereum’s ecosystem, believing it is a “game changer.” While Cowen wasn’t overly optimistic, the analyst refrained from forecasting ETH’s next moves, primarily due to the unpredictable ripple effects of The Merge. The Merge: A Game-Changing Variable? The Merge, a much-anticipated Ethereum upgrade, has already marked its influence on the ETH / BTC valuation. Ethereum’s weekly charts have been in a continuous downtrend following its implementation, creating further lows. Cowen recognizes that The Merge, with its deflationary component, could mean ETH might not toe its historical line. This deflationary aspect could be Ethereum’s wild card, making its trajectory even more elusive. Notably, while many parallels might be drawn between 2019 and 2023, such updates as The Merge means that Ethereum’s journey this year might still hold a few surprises. Related Reading: Here’s Why The Ethereum Price Fell Toward $1,500 Meanwhile, the Ethereum price against the US dollar has seen quite a bearish trend, particularly over the past week. The second largest crypto by market capitalization has plunged nearly 5% in the past 7 days, bringing its price to fall below $1,600 with a current trading price of $1,569. Featured image from Unsplash, Chart from TradingView

Some facts of Bitcoin as legal tender in El Salvador, what happened during these 2 years?

Next month is coming one of the most complete analyses of Bitcoin in El Salvador as legal tender from one of the biggest financial entities in Central America.. I am bringing from first hand here, I am sharing some facts will be included in the report. I will try to keep it simple. Chivo Wallet…
Read more

Bitcoin Price Slides As Bombs Rain on Gaza And Deaths Toll Rise

Bitcoin price is moving lower below the $27,200 support. BTC could decline further if the Israel-Hamas war escalates in the near term. Bitcoin is moving lower and showing bearish signs below $27,500. The price is trading below $27,500 and the 100 hourly Simple moving average. There is a key bearish trend line forming with resistance near $27,550 on the hourly chart of the BTC/USD pair (data feed from Kraken). The pair could accelerate lower below the $27,000 support in the near term. Bitcoin Price Starts Descend Bitcoin price failed to gain pace above the $27,800 resistance. BTC reacted to the downside amid rising Israel-Hamas tensions. There were more than 1200 deaths reported already by Israel. The price is moving lower below the $27,500 pivot level. There was also a downside break below the 76.4% Fib retracement level of the upward move from the $27,185 swing low to the $28,284 high. More importantly, the price traded below the key $27,200 support zone. Bitcoin is now trading below $27,500 and the 100 hourly Simple moving average. There is also a key bearish trend line forming with resistance near $27,550 on the hourly chart of the BTC/USD pair. If there is an upside correction, the price might face resistance near the $27,400 level. The next key resistance could be near the $27,500 level and the trend line. The first major resistance is $27,800, above which Bitcoin might test $28,250. Source: BTCUSD on TradingView.com The main downtrend resistance could be $28,500. A close above the $28,500 resistance could start another increase. In the stated case, the price could rise toward the $30,000 resistance. More Losses In BTC? If Bitcoin fails to recover higher above the $27,500 resistance, there could be more losses. Immediate support on the downside is near the $27,000 level or the 1.236 Fib extension level of the upward move from the $27,185 swing low to the $28,284 high. The next major support is near the $26,500 level. A downside break and close below the $26,500 support might send the price further lower. The next support sits at $26,000. Technical indicators: Hourly MACD – The MACD is now gaining pace in the bearish zone. Hourly RSI (Relative Strength Index) – The RSI for BTC/USD is now below the 50 level. Major Support Levels – $27,000, followed by $26,500. Major Resistance Levels – $27,400, $27,500, and $28,500.