Category: Cryptocurrency News

Cryptocurrency News and Public Mining Pools

XRP Price Prediction – Chances Of Steep Decline If It Closes Below This Level

XRP price is attempting a fresh increase from $0.4730 against the US Dollar. The price could climb toward $0.5320 unless there is a downside break below $0.4880. XRP is struggling to gain pace above the $0.5065 resistance against the US dollar. The price is now trading below $0.500 and the 100 simple moving average (4 hours). There was a break above a major bearish trend line with resistance near $0.4915 on the 4-hour chart of the XRP/USD pair (data source from Kraken). The pair might continue to move down if it breaks the $0.4880 support zone. XRP Price Eyes Recovery After a steady decline, XRP found support near the $0.4730 zone. The price started a recovery wave above the $0.480 level, like Bitcoin and Ethereum. There was a move above the $0.4880 resistance. The bulls pushed it above the 23.6% Fib retracement level of the main drop from the $0.5510 swing high to the $0.4730 low. Besides, there was a break above a major bearish trend line with resistance near $0.4915 on the 4-hour chart of the XRP/USD pair. However, the bears remained active above the $0.500 resistance zone. The price is now trading below $0.500 and the 100 simple moving average (4 hours). On the upside, immediate resistance is near the $0.500 level. The first major resistance is near the $0.5065 level and the 100 simple moving average (4 hours) or the 50% Fib retracement level of the main drop from the $0.5510 swing high to the $0.4730 low. Source: XRPUSD on TradingView.com A close above the $0.5065 level could send the price toward the $0.521 resistance. A successful break above the $0.521 resistance level might start a strong increase toward the $0.550 resistance. Any more gains might send XRP toward the $0.585 resistance. More Losses? If XRP fails to clear the $0.5065 resistance zone, it could continue to move down. Initial support on the downside is near the $0.488 zone. The next major support is at $0.4730. If there is a downside break and a close below the $0.4730 level, XRP price might accelerate lower. In the stated case, the price could retest the $0.4320 support zone. Technical Indicators 4-Hours MACD – The MACD for XRP/USD is now losing pace in the bullish zone. 4-Hours RSI (Relative Strength Index) – The RSI for XRP/USD is now above the 50 level. Major Support Levels – $0.488, $0.473, and $0.432. Major Resistance Levels – $0.5065, $0.5210, and $0.550.

‘I’m still not seeing it’ — Judges skeptical of Ryder Ripps’ BAYC appeal

The lawyer representing Ryder Ripps and Jeremy Cahen struggled to convince a panel of judges that Yuga Labs’ case against his clients should be thrown out under California’s anti-SLAPP statute.

What people expect to happen, the opposite happens. Let’s do a real life case study with DOT in just 7 days.

On October 24th around 115,000,000 DOT will be unlocked from the previous crowdloans two years ago. That's around $400,000,000 unlocked at the same time, at all time low MC value, in a bear market. What do you guys really think will happen? In the DOT community chats I've been reading, people are saying "Most of…
Read more

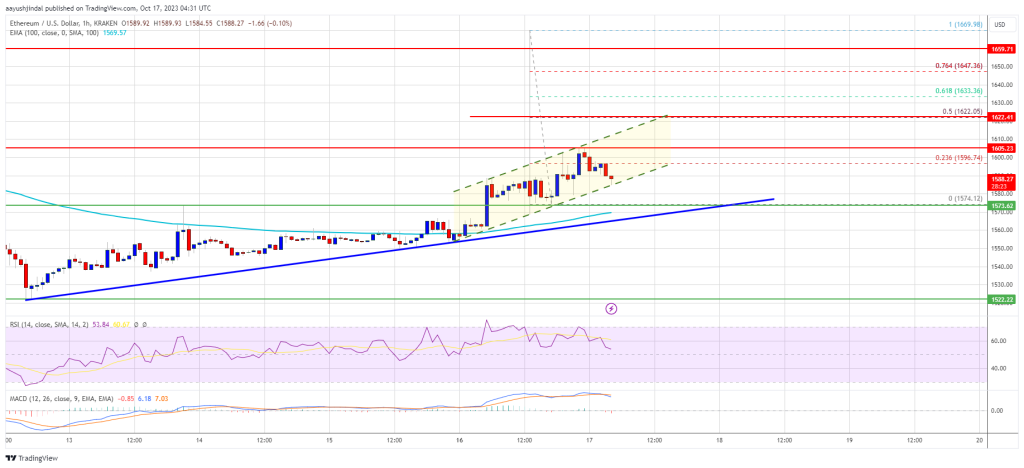
Ethereum Price Faces Crucial Test: Will $1,570 Withstand the Pressure?

Ethereum price started a steady increase from the $1,520 zone against the US dollar. ETH is now struggling to clear the $1,605 and $1,620 resistance levels. Ethereum is attempting a recovery wave above the $1,570 level. The price is trading just above $1,575 and the 100-hourly Simple Moving Average. There is a key bullish trend line forming with support near $1,572 on the hourly chart of ETH/USD (data feed via Kraken). The pair could rise further if there is a close above the $1,620 resistance level. Ethereum Price Gains Traction Ethereum started a fresh increase from the $1,520 level. ETH gained traction like Bitcoin and spiked above the $1,600 resistance level. It even climbed above $1,620, but the bears appeared near $1,650. A high was formed near $1,669 before there was a fresh decline. Ether trimmed gains and settled below the $1,600 level. It tested the $1,575 support and is currently consolidating near the 23.6% Fib retracement level of the recent decline from the $1,669 swing high to the $1,574 low. Ethereum is now trading just above $1,575 and the 100-hourly Simple Moving Average. There is also a key bullish trend line forming with support near $1,572 on the hourly chart of ETH/USD. On the upside, the price is facing resistance near the $1,605 level. The first major resistance is near the 50% Fib retracement level of the recent decline from the $1,669 swing high to the $1,574 low at $1,620. A close above the $1,620 resistance might start a decent increase. Source: ETHUSD on TradingView.com In the stated case, Ether could rise and recover toward the $1,665 resistance. Any more gains might open the doors for a move toward $1,750. Another Decline in ETH? If Ethereum fails to clear the $1,605 resistance, it could start another decline. Initial support on the downside is near the $1,575 level and the 100-hourly Simple Moving Average. The next key support is $1,550. A downside break below the $1,550 support might send the price further lower. In the stated case, the price could drop toward the $1,520 level. Any more losses may perhaps send Ether toward the $1,440 level. Technical Indicators Hourly MACD – The MACD for ETH/USD is losing momentum in the bullish zone. Hourly RSI – The RSI for ETH/USD is now above the 50 level. Major Support Level – $1,575 Major Resistance Level – $1,620

Dev platform Stack Overflow axes 28% of staff as AI competition grows

The technology Q&A forum has seen declines in web traffic since the launch of ChatGPT in 2022.

Pennsylvania Scraps Crypto Mining Moratorium and Revives Mining Study

submitted by /u/raymv1987 [link] [comments]

FTX customers could get $9B shortfall claim payout by mid-2024

A proposed settlement could see creditors receive a shortfall claim of $8.9 billion for FTX.com and $166 million for FTX US.

Pennsylvania crypto mining permit halt cut from bill after union pressure

The bill’s sponsor Greg Vitali included a clause that instead subjects miners to ongoing reporting requirements to get the bill past a House Committee.

Bitcoin Price Key Indicators Suggest Fresh Rally Toward $30K

Bitcoin price spiked toward $30,000 after fake news about spot ETF hit the market. BTC is now consolidating above $28,200 and could rise toward $29,200. Bitcoin is holding gains above the $28,000 and $28,200 levels. The price is trading above $28,200 and the 100 hourly Simple moving average. There is a key bullish trend line forming with support near $28,000 on the hourly chart of the BTC/USD pair (data feed from Kraken). The pair could start a fresh increase if there is a clear move above the $28,800 resistance. Bitcoin Price Aims Higher Bitcoin price started a strong increase above the $27,500 resistance zone. BTC saw a wild increase after fake news about the spot ETF approval hit the market. There was a nasty increase above the $28,500 resistance. The price even spiked toward $30,000 before trimming gains. There was a drop below the $29,200 and $28,800 support levels. The price even declined below the 50% Fib retracement level of the upward move from the $26,820 swing low to the $30,000 high. Bitcoin price is now trading above $28,200 and the 100 hourly Simple moving average. There is also a key bullish trend line forming with support near $28,000 on the hourly chart of the BTC/USD pair. The trend line is near the 61.8% Fib retracement level of the upward move from the $26,820 swing low to the $30,000 high. On the upside, immediate resistance is near the $28,600 level. The next key resistance could be near $28,800. A clear move above the $28,600 and $28,800 resistance levels could set the pace for a larger increase. The next key resistance could be $29,200. Source: BTCUSD on TradingView.com A close above the $29,200 resistance might start a steady increase toward the $29,500 level. Any more gains might send BTC toward the $30,000 level. Another Decline In BTC? If Bitcoin fails to rise above the $28,800 resistance zone, it could slide further. Immediate support on the downside is near the $28,000 level and the trend line zone. The next major support is near the $27,800 level. A downside break and close below the $27,800 support might send the price further lower. The next support sits at $27,200 and the 100 hourly Simple moving average. Technical indicators: Hourly MACD – The MACD is now gaining pace in the bullish zone. Hourly RSI (Relative Strength Index) – The RSI for BTC/USD is now above the 50 level. Major Support Levels – $28,000, followed by $27,800. Major Resistance Levels – $28,600, $28,800, and $29,200.

Spam NFTs send to ETH address

So scammers are now sending spam nfts to my Ethereum address. What’s their angle spending $40 to send an nft? Seems like a waste of time and money if you ask me! submitted by /u/PrincePhilipTheFirst [link] [comments]