Bitcoin Forms Golden Cross On 2-Month Chart, Here’s What Happened Last Time
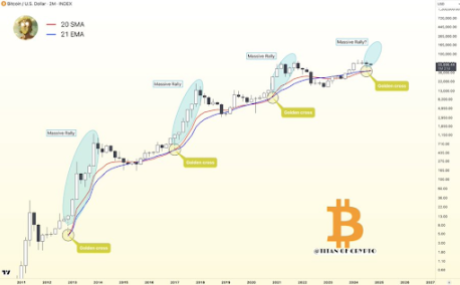
Crypto analyst Titan of Crypto has highlighted a bullish indicator on the Bitcoin chart. The analyst also revealed what happened the last time this pattern formed, suggesting that the leading crypto could enjoy a significant price rally soon enough. Golden Cross Forms On The Bitcoin Chart Titan of Crypto revealed in an X (formerly Twitter) post that Golden Cross has formed on Bitcoin’s 2-month chart. He added that the leading crypto company experienced a “massive” rally every time this bullish indicator appeared on its 2-month chart. His accompanying chart showed that this happened last in 2021 when Bitcoin rose from around $13,000 to above $60,000. Related Reading: Shiba Inu Accumulation: Whales Pull Out $4 Million From Exchanges, Can SHIB Recover? While it remains to be seen what will happen this time, there is no doubt that a significant rally is long overdue for the leading crypto, considering how its price has stagnated since reaching a new all-time high (ATH) of $73,000 in March earlier this year. In another X post, Titan of Crypto suggested that the much-anticipated Bitcoin rally could begin in October. The crypto analyst noted how the historical bearish September always sets the stage for risk assets like Bitcoin and US stocks to end the year with a big bounce. Meanwhile, Titan of Crypto is still confident about Bitcoin’s bullish outlook despite calls that it is now in a downtrend. He stated that Bitcoin is still bullish on the monthly timeframe. He added that the crypto is still holding its Tenkan and claimed that its bullish outlook will remain intact as long as it holds above the Tenkan line at $49,900. Based on the accompanying chart he shared, Bitcoin needs to break above $71,000 to reach a new ATH in this market cycle. The crypto analyst had earlier predicted that the flagship crypto could reach a market high of $120,000 by 2025. October Is The Month To Look Forward To Crypto analyst Rekt Capital also echoed a sentiment similar to Titan of Crypto, suggesting that October is the month to look forward to. He noted that history suggests Bitcoin should enjoy a breakout from the reaccumulation range in the next two weeks. However, he added that there is a higher chance that the breakout will occur in October. Related Reading: AAVE Breakout: Why A 1,710% Surge Is On The Horizon October is historically a strong month for the leading crypto, especially in halving years like this one. A potential Bitcoin rally in October is expected to extend into November and December. Rekt Capital highlighted how the crypto has enjoyed three straight months of upside in the fourth quarter of the 2016 and 2020 halving years. At the time of writing, Bitcoin is trading at around $57,700, up over 3% in the last 24 hours, according to data from CoinMarketCap. Featured image created with Dall.E, chart from Tradingview.com