Metaplanet shares jump 15% after buying 107 Bitcoin
Metaplanet has already doubled its Bitcoin holdings this month across four purchases totaling over 450 Bitcoin.
Metaplanet has already doubled its Bitcoin holdings this month across four purchases totaling over 450 Bitcoin.
Grayscale listed 35 cryptocurrencies it’s mulling to potentially include in its suite of crypto investment products.

Utah Republican senator Mike Lee outlined three major regulatory risks to the cryptocurrency industry at the recent Permissionless III crypto conference. They are the creation of a central bank digital currency (CBDC), fragmented state regulations, and heavy federal oversight. He warned these could threaten the digital assets sector, saying, “Cryptocurrency is not a security. Cryptocurrency […]
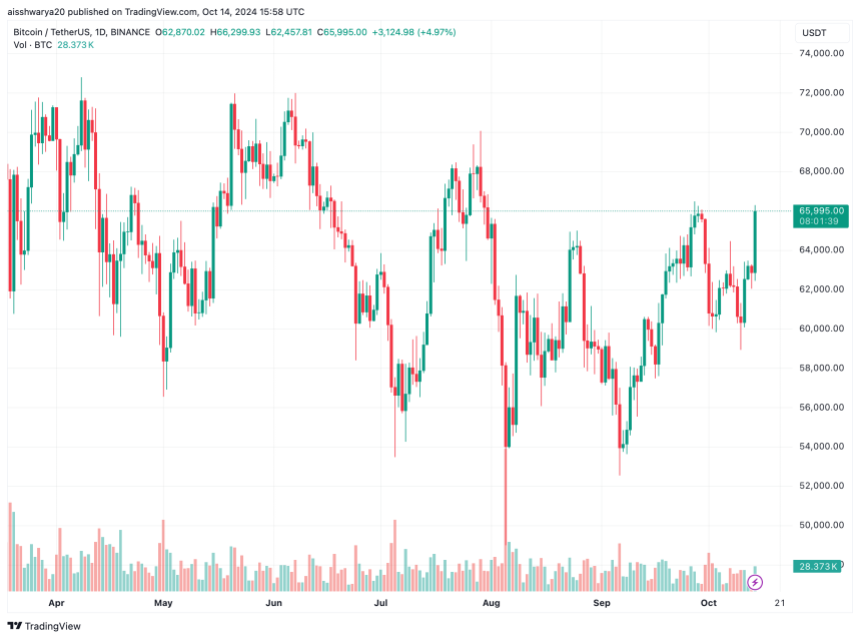
In an October 14 announcement, Malta-based Samara Asset Group revealed plans to increase its Bitcoin (BTC) holdings through proceeds from a $32.8 million bond issuance. Samara Targets 1,000 Bitcoin Milestone Publicly-listed asset management firm Samara announced it had mandated investment bank Pareto Securities as a sole manager to schedule a series of fixed-income investor meetings to potentially issue up to a €30 million or $32.8 million Nordic bond. Related Reading: MicroStrategy’s Bitcoin Bet Pays Off In Multiple Ways As Stock Surges 317% Notably, the proceeds from the bond issuance will be utilized toward expanding Samara’s existing investment portfolio by acquiring additional limited partnership stakes in alternative investment funds. Additionally, the funds raised will help Samara boost its Bitcoin holdings. The firm confirmed it uses BTC as its “primary treasury reserve asset,” and currently holds “around 421 BTC,” according to CEO Patrick Lowry. Commenting on the development, Lowry said: The proceeds will allow Samara to further expand and solidify its already robust balance sheet as we diversify into new emerging technologies through new fund investments. With Bitcoin as our primary treasury reserve asset, we also enhance our liquidity position with bond proceeds. He added that Samara has been holding BTC “for years” and aims to increase its reserves while investing in disruptive technology. Lowry also mentioned that, while it may be challenging, it would “be a dream to stack as much as Michael Saylor,” CEO of MicroStrategy. According to data from CoinGecko, MicroStrategy leads the global list of publicly traded companies purchasing BTC for their corporate treasury. As of October 14, MicroStrategy holds more than 252,000 BTC or approximately 1.2% of the total circulating supply. Saylor has also been quite vocal about sharing ambitious Bitcoin price targets. In September 2024, the MicroStrategy CEO predicted that BTC could soar to as high as $13 million by 2045. BTC Remains The Preferred Digital Asset Ahead Of ETH, SOL Despite the rapid advancements in smart contract ecosystems like Ethereum (ETH) and Solana (SOL), Bitcoin remains the dominant choice for companies as part of their treasury management strategy. Several factors contribute to Bitcoin’s dominance in institutional adoption. For instance, the US Securities and Exchange Commission’s (SEC) approval of Bitcoin exchange-traded funds (ETFs) has further cemented BTC as a reliable digital asset with regulatory clarity. Although Ethereum ETFs have also received regulatory approval, the second-largest cryptocurrency by market cap has not seen the same level of institutional adoption in corporate balance sheets. Related Reading: Grayscale Unveils First XRP Trust In The US, ETF Ahead? In related news, Japan’s Metaplanet has also been working toward bolstering its Bitcoin reserves. In September 2024, the early-stage investment firm stated it had bought an additional $2 million worth of BTC. Bitcoin trades at $65,995 at press time, up 6.1% in the last 24 hours. Featured image from Unsplash.com, Chart from TradingView.com
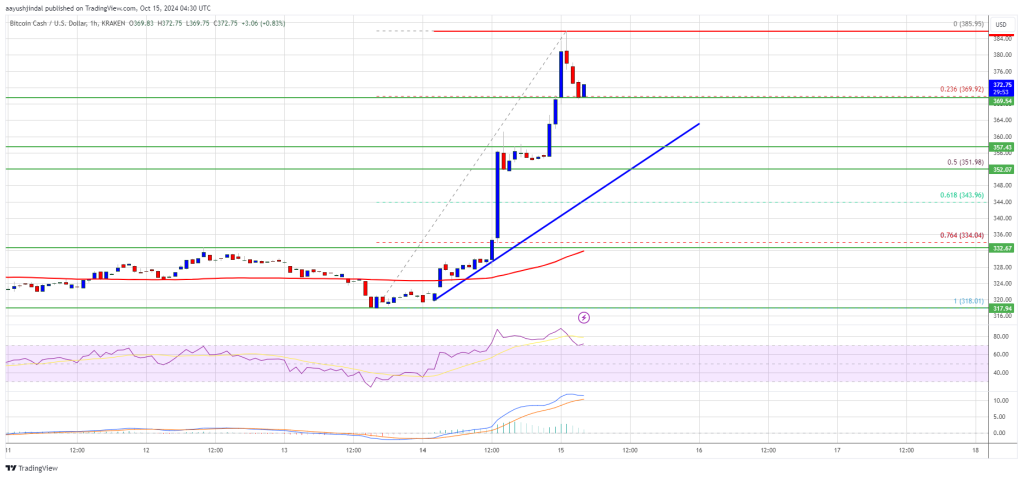
Bitcoin Cash price started a major increase above the $350 resistance. BCH is consolidating and might aim for more gains above the $385 resistance. Bitcoin cash price started a fresh increase above the $350 level. The price is trading above $365 and the 100-hour simple moving average. There is a connecting bullish trend line forming with support at $355 on the hourly chart of the BCH/USD pair (data feed from Kraken). The pair could start another increase if it clears the $380 resistance zone. Bitcoin Cash Price Starts Fresh Surge After forming a base above the $315 level, Bitcoin Cash price started a fresh increase. BCH outpaced Bitcoin and Ethereum to gain over 20%. There was a clear move above the $350 resistance zone. The price even surpassed $365 and tested the $385 resistance zone. A high was formed near $385.95 and the price is now correcting gains. There was a minor move below the $375 level. The price dipped and tested the 23.6% Fib retracement level of the upward move from the $318.02 swing low to the $385.95 high. Bitcoin cash price is now trading above $365 and the 100-hour simple moving average. There is also a connecting bullish trend line forming with support at $355 on the hourly chart of the BCH/USD pair. The trend line is close to the 50% Fib retracement level of the upward move from the $318.02 swing low to the $385.95 high. Immediate resistance on the upside sits near the $380 level. A clear move above the $380 resistance might start a decent increase. The next major resistance is $385, above which the price might accelerate higher toward the $400 level. Any further gains could lead the price toward the $420 resistance zone. Fresh Drop in BCH? If Bitcoin Cash price fails to clear the $380 resistance, it could start a fresh decline. Initial support on the downside is near the $365 level. The next major support is near the $355 level or the trend line. If the price fails to stay above the $355 support, the price could test the $340 support. Any further losses could lead the price toward the $332 zone in the near term. Technical indicators 4-hour MACD – The MACD for BCH/USD is losing pace in the bullish zone. 4-hour RSI (Relative Strength Index) – The RSI is currently above the 50 level. Key Support Levels – $365 and $355. Key Resistance Levels – $380 and $385.
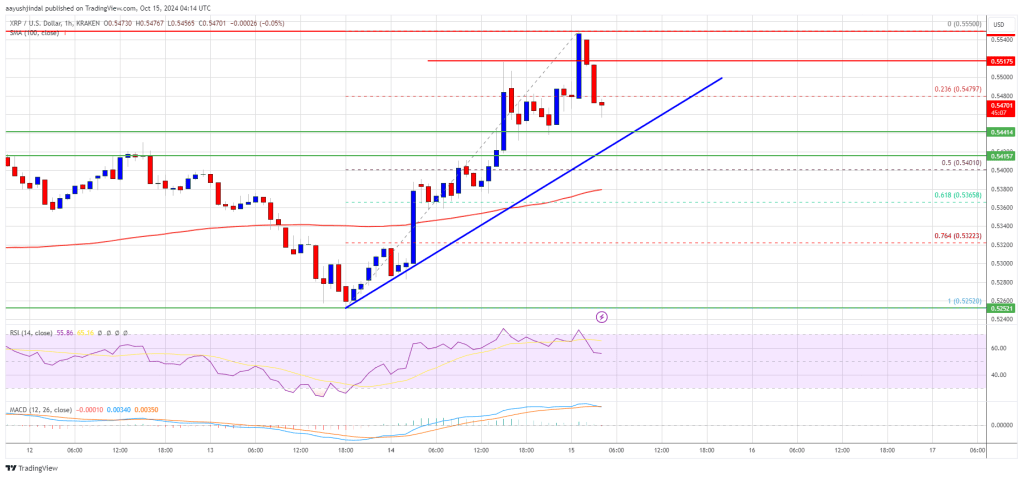
XRP price is moving higher above the $0.5350 support. The price tested the $0.5550 resistance and seems to be struggling to continue higher. XRP price is attempting a fresh increase above the $0.540 zone. The price is now trading above $0.5420 and the 100-hourly Simple Moving Average. There is a key bullish trend line forming with support at $0.5400 on the hourly chart of the XRP/USD pair (data source from Kraken). The pair could trim most gains if it fails to stay above the $0.540 support zone. XRP Price Revisits Resistance XRP price remained stable above the $0.5320 support. A base was formed and the price started a fresh increase above $0.5400 like Bitcoin and Ethereum. The price climbed above the $0.5450 and $0.550 resistance levels. However, the bears are active near the key range resistance at $0.5550. A high is formed at $0.5550 and the price is now correcting gains. There was a move below the $0.550 level. The price dipped below the 23.6% Fib retracement level of the upward move from the $0.5252 swing low to the $0.5550 high. The price is now trading above $0.540 and the 100-hourly Simple Moving Average. There is also a key bullish trend line forming with support at $0.5400 on the hourly chart of the XRP/USD pair. On the upside, the price might face resistance near the $0.5540 level. The first major resistance is near the $0.5550 level. The next key resistance could be $0.5650. A clear move above the $0.5650 resistance might send the price toward the $0.5800 resistance. Any more gains might send the price toward the $0.5880 resistance or even $0.600 in the near term. The next major hurdle might be $0.6120, where the bears might emerge. Another Decline? If XRP fails to clear the $0.5550 resistance zone, it could start another decline. Initial support on the downside is near the $0.5440 level and the trend line. The next major support is near the $0.5400 level or the 50% Fib retracement level of the upward move from the $0.5252 swing low to the $0.5550 high. If there is a downside break and a close below the $0.5400 level, the price might continue to decline toward the $0.5320 support in the near term. The next major support sits near the $0.5220 zone. Technical Indicators Hourly MACD – The MACD for XRP/USD is now losing pace in the bullish zone. Hourly RSI (Relative Strength Index) – The RSI for XRP/USD is now above the 50 level. Major Support Levels – $0.5440 and $0.5400. Major Resistance Levels – $0.5540 and $0.5550.
Blockchain security firm SlowMist found a growing number of people lost funds to fake trading bots that use OpenAI’s ChatGPT in the name to build legitimacy.
After a brief dip below the $60,000 mark on October 10, Bitcoin (BTC) has regained momentum, inching closer to its all-time high (ATH) of $73,700, reached in March of this year. This price recovery follows considerable volatility experienced by the largest cryptocurrency on the market throughout the year, with significant price swings, including sharp falls of almost 20% on 5 August and 6 September. Despite these setbacks, indicators suggest that the bull run that investors have been anticipating for the last quarter of the year may still be on the horizon. Crypto analyst Ali Martinez recently highlighted BTC’s recovery just below the $66,000 mark, stressing that if this level can be maintained in the coming days, further gains could be in store. Historical Patterns Suggest Bitcoin Could Surge Past $70,000 In a series of posts on social media platform X (formerly Twitter), Martinez pointed out that Bitcoin is once again attempting to break through the critical 200-day moving average (MA), which currently sits between $63,000 and $64,000 on the daily chart. The analyst noted that after four previous rejections at this level this year, Bitcoin’s repeated attempts to break above this level could signal a significant turning point for the upcoming price action. Related Reading: Crypto Analyst Predicts ‘Giga Pump’ For XRP Price, Here’s The Target Martinez also highlighted a historical pattern: each of the last three times Bitcoin successfully broke above the 200-day moving average, it led to parabolic bull runs. This suggests that if Bitcoin can consolidate above this key level for the remainder of the month, the likelihood of exceeding the $70,000 mark for the first time in nearly three months increases significantly. Looking ahead, the analyst has set a target of $78,000 for Bitcoin in the near term. Historical Trends And Election Dynamics Fuel Optimism Bloomberg recently highlighted Bitcoin’s price recovery, linking it to improving expectations around the US regulatory landscape for cryptocurrencies, particularly in the wake of the upcoming presidential election. Democratic nominee and Vice President Kamala Harris announced her commitment to establishing a supportive regulatory framework for crypto, coinciding with outreach efforts aimed at Black male voters as election day approaches. In contrast, Harris’ Republican rival Donald Trump has positioned himself as a strong advocate for the digital asset industry, including promises to make changes to the US Securities and Exchange Commission (SEC) and to establish a Bitcoin reserve for the nation, which Bloomberg believes could resonate with voters in a close race. Noelle Acheson, author of the Crypto Is Macro Now newsletter, noted that recent market movements appear to be election-driven. Initially, Bitcoin’s uptick was influenced by Trump’s lead in prediction markets and polls. This was followed by favorable comments regarding crypto from the Harris campaign, suggesting a less restrictive approach compared to the current Biden administration. Although specifics of Harris’s crypto policy remain unclear, the sentiment indicates a potential shift toward a more positive regulatory environment. Related Reading: Why Isn’t XRP Price Moving? Crypto Pundit Claims The Answer In addition, October has historically been a strong month for BTC, with the cryptocurrency gaining an average of 20% during this time over the past decade. Sean Farrell, head of digital asset strategy at Fundstrat Global Advisors LLC, pointed out that historical trends suggest that this seasonal strength is typically more pronounced in the second half of the month, suggesting that BTC’s price could see further gains as the month progresses. At the time of writing, Bitcoin is trading at $65,970, up more than 5% in the 24-hour time frame. Featured image from DALL-E, chart from TradingView.com
More than half a billion dollars flowed into spot Bitcoin ETFs in the US as the cryptocurrency topped $66,000.
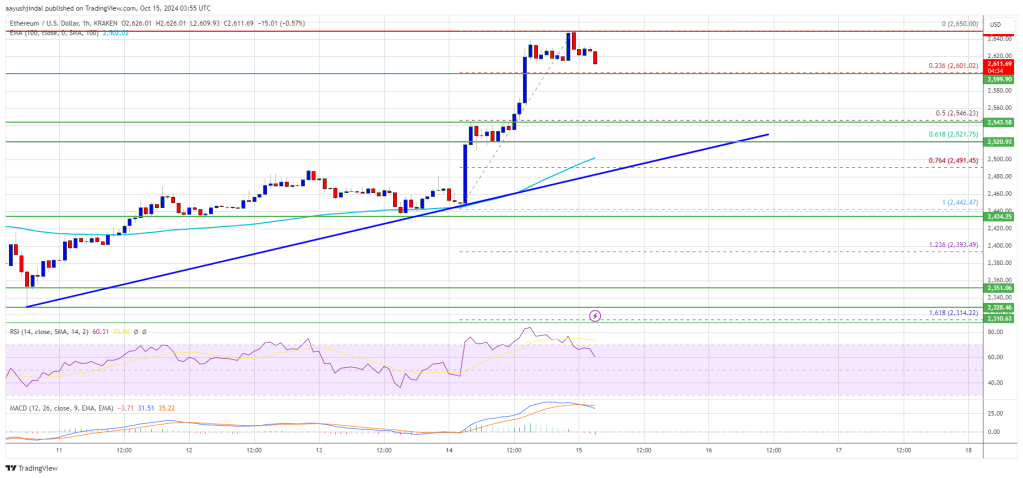
Ethereum price started a fresh increase above the $2,500 resistance. ETH is up over 5% and might continue to rise if it clears the $2,650 resistance. Ethereum started a fresh increase above the $2,500 and $2,550 resistance levels. The price is trading above $2,550 and the 100-hourly Simple Moving Average. There is a key bullish trend line forming with support near $2,52 on the hourly chart of ETH/USD (data feed via Kraken). The pair could continue to rally if it clears the $2,620 and $2,650 resistance levels. Ethereum Price Jumps Over 5% Ethereum price formed a base above the $2,400 level and started a fresh increase. ETH cleared the $2,450 and $2,500 resistance levels to move into a positive zone, beating Bitcoin. The bulls even pushed the price above the $2,600 level. A high was formed at $2,650 and the price is now consolidating gains. The price is stable above the 23.6% Fib retracement level of the upward wave from the $2,442 swing low to the $2,650 high. Ethereum price is now trading above $2,550 and the 100-hourly Simple Moving Average. There is also a key bullish trend line forming with support near $2,52 on the hourly chart of ETH/USD. On the upside, the price seems to be facing hurdles near the $2,640 level. The first major resistance is near the $2,650 level. A clear move above the $2,650 resistance might send the price toward the $2,720 resistance. An upside break above the $2,720 resistance might call for more gains in the coming sessions. In the stated case, Ether could rise toward the $2,800 resistance zone in the near term. The next hurdle sits near the $2,880 level or $2,920. Another Decline In ETH? If Ethereum fails to clear the $2,650 resistance, it could start another decline. Initial support on the downside is near the $2,600 level. The first major support sits near the $2,520 zone and the trend line or the 61.8% Fib retracement level of the upward wave from the $2,442 swing low to the $2,650 high. A clear move below the $2,520 support might push the price toward $2,450. Any more losses might send the price toward the $2,400 support level in the near term. The next key support sits at $2,350. Technical Indicators Hourly MACD – The MACD for ETH/USD is losing momentum in the bullish zone. Hourly RSI – The RSI for ETH/USD is now above the 50 zone. Major Support Level – $2,600 Major Resistance Level – $2,650